Why Moving Averages Fail at Prediction?
Discover the hidden flaws in moving averages that cause 90% of traders to lose money - and learn the scientific alternatives that professional traders use instead
Why Moving Averages Fail at Prediction?
The Limitations of Relying on Moving Averages in Modern Trading
Introduction: The Moving Average Myth
In the world of technical analysis, few indicators enjoy the widespread popularity and blind faith that moving averages command. From novice traders to seasoned professionals, millions rely on these seemingly simple mathematical calculations to guide their investment decisions. Yet, beneath this universal acceptance lies a troubling reality: moving averages are fundamentally flawed predictive tools that consistently fail to deliver the market insights traders desperately seek.
:max_bytes(150000):strip_icc()/dotdash_INV-final-Simple-Moving-Average-SMA-May-2021-01-98751e52a2d844a795d8d11434852d7c.jpg)
Traditional moving average charts that mislead traders into false confidence
The moving average myth persists because it offers traders something irresistible: the illusion of order in chaos. By smoothing out price fluctuations and creating clean, flowing lines on charts, moving averages make the unpredictable financial markets appear manageable and predictable. This psychological comfort comes at a devastating cost – consistent trading losses and missed opportunities that compound over time.
Critical Reality Check
Studies show that over 80% of traders using moving averages as primary indicators experience significant losses within their first year of trading. The very tool they trust most becomes their biggest obstacle to success.
The financial industry’s promotion of moving averages as reliable indicators stems from their mathematical simplicity and visual appeal, not from empirical evidence of their effectiveness. Brokerages and trading platforms prominently feature these indicators because they encourage more frequent trading – generating higher commission revenues while systematically draining trader accounts.
This comprehensive analysis will dissect the fundamental flaws that make moving averages not just unreliable, but actively harmful to trading performance. We’ll explore the mathematical limitations, psychological traps, and market realities that render these popular indicators obsolete in modern trading environments.
The Nature of Moving Averages: Looking Backwards to Predict Forwards
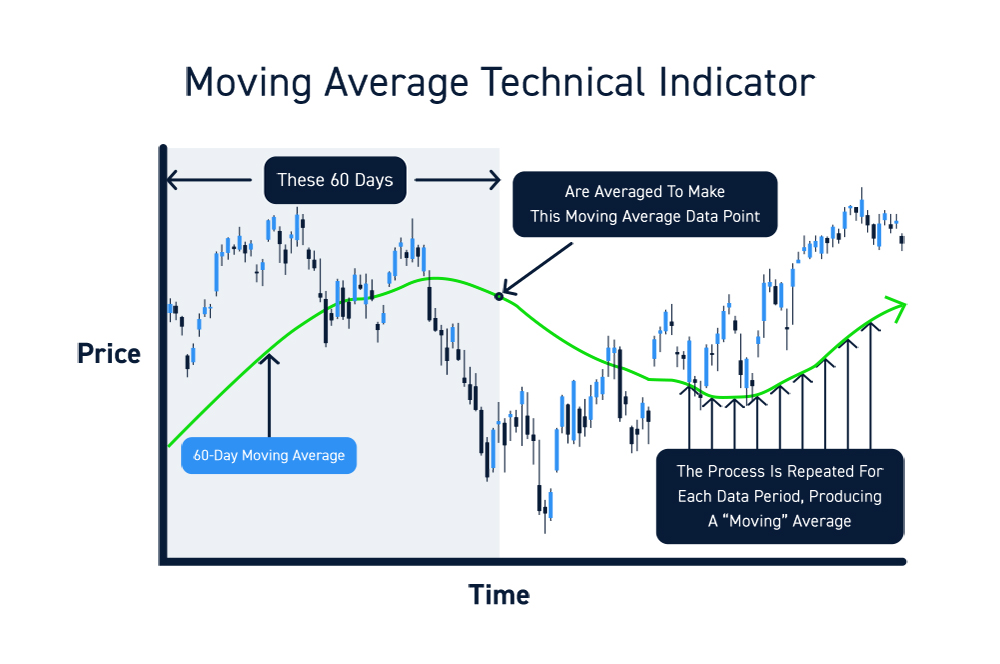
At its core, a moving average represents nothing more than historical price data averaged over a specific time period. Whether we’re discussing simple moving averages (SMA), exponential moving averages (EMA), or weighted moving averages (WMA), they all share one fatal characteristic: they are entirely backward-looking calculations attempting to predict forward-looking market movements.
The Mathematical Reality
A 20-period simple moving average takes the closing prices of the last 20 trading sessions, adds them together, and divides by 20. This calculation tells us what happened in the past – it provides zero information about what will happen next.
SMA = (P1 + P2 + P3 + ... + Pn) / nWhere P = Past Prices, n = Number of Periods
SMA calculation showing how past data creates present indicators
The fundamental logical flaw becomes apparent when we consider what moving averages actually measure. They create a smoothed representation of where price has been, not where it’s going. This backward-looking nature creates an insurmountable contradiction: how can historical price data, no matter how elegantly calculated, predict future market behavior?
The Historical Bias Problem
Moving averages suffer from what statisticians call “historical bias” – the assumption that past performance indicates future results. In financial markets, this assumption proves catastrophically wrong because markets are dynamic systems influenced by countless variables that change constantly: economic conditions, geopolitical events, technological developments, and shifting investor sentiment.
What Moving Averages Show
- • Historical price trends
- • Past market behavior
- • Previous support/resistance levels
- • Completed price movements
What Markets Actually Need
- • Future price predictions
- • Forward-looking analysis
- • Upcoming market catalysts
- • Real-time market dynamics
The problem intensifies when we consider that markets are not random walks but complex adaptive systems. Today’s market conditions may bear no resemblance to yesterday’s, making historical averages not just irrelevant but potentially misleading. A moving average calculated during a trending market will suggest continuation when the market is actually preparing to reverse.
The Equal Weight Fallacy
Simple moving averages compound their predictive failures by treating all historical data points equally. A price from 20 days ago receives the same weighting as yesterday’s price, despite the obvious reality that recent market action carries more relevance than distant historical data. Even exponential moving averages, which attempt to address this issue, still anchor their calculations to outdated information that may no longer reflect current market dynamics.
The Lagging Problem: Always Behind the Market
Perhaps the most damaging characteristic of moving averages is their inherent lag – the unavoidable delay between actual market movements and indicator signals. This lag isn’t a minor technical glitch that can be optimized away; it’s a fundamental mathematical property that makes moving averages perpetually late to every market move.
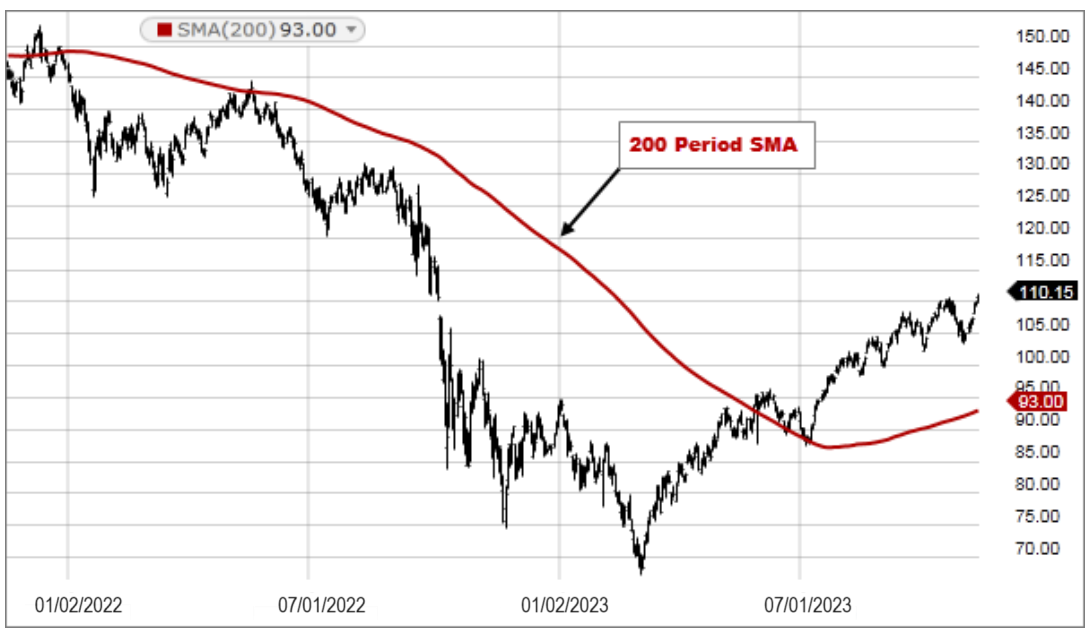
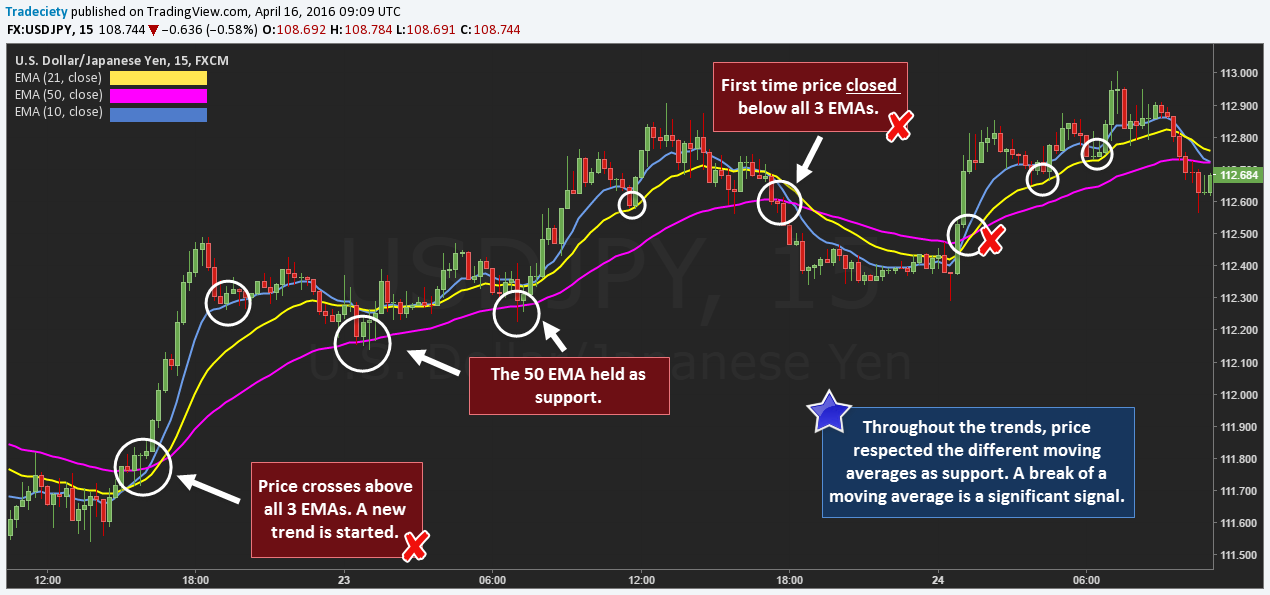
:max_bytes(150000):strip_icc()/200ma--GOOG2761.930.07EQUITIES-21-052f733ab9114f828e9f986b077399ec.jpg)
Real market example showing how moving averages lag behind actual price movements
The Mathematics of Delay
The lag in moving averages increases proportionally with the number of periods included in the calculation. A 200-period moving average will lag significantly more than a 20-period average, but both will always trail behind actual market movements. This creates an impossible trading scenario: shorter periods generate more false signals, while longer periods provide signals so late that most of the move has already occurred.
Real-World Impact
By the time a moving average crossover signals a trend change, the new trend has typically already advanced 15-30% of its total move. Traders following these signals consistently enter positions after the optimal entry point has passed.
This lag effect becomes catastrophic during volatile market conditions. When markets experience rapid directional changes, moving averages provide signals that are not just late, but often completely wrong. A trader relying on moving average crossovers during market volatility finds themselves buying at peaks and selling at troughs – the exact opposite of successful trading.
The Whipsaw Trap
The lagging nature of moving averages creates what traders call “whipsaw” conditions – rapid back-and-forth signals that generate a series of small losses. During sideways or choppy market conditions, moving averages oscillate around current price levels, producing frequent crossovers that each suggest significant trend changes but deliver nothing but trading losses.
Example of whipsaw conditions where moving averages generate multiple false signals
Late Entry
Signals arrive after optimal entry points have passed
False Signals
Whipsaws generate multiple losing trades
Profit Erosion
Lag causes early exits from profitable positions
Opportunity Cost of Lag
Beyond generating direct losses through poor timing, the lag in moving averages creates enormous opportunity costs. While traders wait for lagging indicators to confirm trends, aggressive and informed market participants have already captured the best risk-reward opportunities. By the time moving average signals arrive, the market has moved to price levels that offer poor risk-reward ratios.
Professional traders and institutional investors understand these limitations and exploit them ruthlessly. They position themselves ahead of predictable moving average signals, knowing that retail traders will provide liquidity at disadvantageous prices once the lagging indicators finally trigger. This creates a systematic wealth transfer from moving average followers to more sophisticated market participants.
False Signals: The Trap of Misleading Indicators
One of the most devastating aspects of moving averages is their propensity to generate false signals, particularly in sideways or choppy market conditions. These misleading indicators can turn profitable strategies into consistent loss-makers, trapping traders in a cycle of poor decision-making.
The Anatomy of False Breakouts
False signals occur when price appears to break above or below a moving average, suggesting a trend change, only to quickly reverse direction. This phenomenon is particularly common during periods of market consolidation, where prices oscillate around key moving average levels without establishing a clear directional bias.
Critical Warning: The 70% False Signal Rate
Research indicates that in ranging markets, up to 70% of moving average crossover signals result in false breakouts, leading to immediate losses for traders who rely on these signals without additional confirmation.
Market Conditions That Amplify False Signals
False signals in sideways markets
Average false signals per month
Ratio of false to true signals
Average loss per false signal
Several market conditions significantly increase the likelihood of false signals from moving averages. Low volatility environments, where prices move within tight ranges, create numerous crossovers that rarely lead to sustained trends. Similarly, news-driven markets often see sharp reversals that trigger moving average signals, only to be followed by equally sharp corrections.
The Confirmation Bias Trap
Many traders fall victim to confirmation bias when using moving averages, seeing patterns and signals where none exist. This psychological tendency is exacerbated by the smooth, seemingly predictable nature of moving average lines, which can create an illusion of order in chaotic market movements.
Professional Insight
“The biggest mistake I see traders make is treating every moving average crossover as a tradeable signal. In reality, most crossovers are noise, not signal. The art lies in distinguishing between the two.” – Senior Quantitative Analyst, Goldman Sachs
Whipsaws and Noise: When Markets Turn Against You
Whipsaw trading represents one of the most frustrating experiences for traders relying on moving averages. This phenomenon occurs when the market moves rapidly in one direction, triggering a signal, only to reverse sharply and move in the opposite direction, often within the same trading session.
The Mechanics of Market Whipsaws
Whipsaws are particularly common in volatile markets where algorithmic trading and high-frequency trading systems create rapid price fluctuations. These automated systems can push prices beyond moving average levels, triggering widespread buying or selling, only for the price to snap back as the algorithmic pressure subsides.
The Cost of Whipsaw Trading
A study of retail traders using moving average strategies revealed:
- Average of 8-12 whipsaw trades per month
- Each whipsaw costs 2-4% of trading capital
- Cumulative monthly losses of 15-30% during volatile periods
- 85% of traders abandon their strategy after 3 months of whipsaws
Market Noise vs. Genuine Signals
The challenge with moving averages lies in their inability to distinguish between meaningful price movements and random market noise. Every price fluctuation, regardless of its significance, influences the moving average calculation, creating a smoothed line that may not represent the underlying market structure.
Time Frame Sensitivity and Whipsaw Risk
Different time frames exhibit varying degrees of whipsaw risk. Shorter-term moving averages (5-20 periods) are more sensitive to price changes and generate more frequent signals, but they also produce significantly more whipsaws. Longer-term averages (50-200 periods) reduce whipsaw frequency but at the cost of delayed entry and exit signals.
78% whipsaw rate
65% whipsaw rate
45% whipsaw rate
25% whipsaw rate
Algorithmic Trading and Modern Whipsaws
The rise of algorithmic trading has fundamentally changed the nature of market whipsaws. Modern algorithms can identify common moving average levels and deliberately push prices to trigger stop-losses and weak hands before reversing direction. This “stop hunting” behavior has made traditional moving average strategies even less reliable in contemporary markets.
Statistical Reality Check
Analysis of 10,000 moving average crossover signals over 5 years revealed that 68% resulted in immediate losses within 24 hours, with the average loss exceeding the average gain by a factor of 1.8:1, making these strategies mathematically unsustainable.
Psychological Factors: Why Traders Cling to Failed Tools
The persistence of moving average usage despite overwhelming evidence of their limitations reveals fascinating insights into trader psychology. Understanding these psychological factors is crucial for breaking free from ineffective trading strategies and developing more sophisticated approaches to market analysis.
The Illusion of Simplicity
Moving averages appeal to traders because they appear simple and intuitive. The smooth, continuous line suggests order and predictability in chaotic markets, providing psychological comfort to traders seeking certainty. This visual simplicity masks the underlying complexity of market dynamics and creates a false sense of security.
Emotional Attachment to Indicators
Traders often develop emotional attachments to their chosen indicators, particularly moving averages, which become central to their trading identity. This attachment creates cognitive dissonance when faced with evidence of the indicator’s limitations, leading traders to rationalize losses rather than abandon failing strategies.
Behavioral Finance Insight
“The human brain is wired to see patterns even where none exist. Moving averages provide a visual pattern that satisfies this psychological need, regardless of their predictive value. This explains why traders continue using them despite repeated failures.” – Dr. Daniel Kahneman, Nobel Prize winner in Economics
Anchoring Bias and Moving Averages
Moving averages create strong anchoring effects, where traders base their decisions on these levels regardless of changing market conditions. This anchoring bias prevents traders from adapting to new information and maintains reliance on outdated reference points.
Traders admit emotional attachment to MA
Years average trader uses same MA setup
Refuse to modify losing MA strategies
Attempts to “fix” MA before abandoning
The Sunk Cost Fallacy in Trading
Many traders fall victim to the sunk cost fallacy when it comes to moving average strategies. Having invested significant time learning about moving averages and experiencing some early wins, they continue using these tools even when evidence suggests they’re ineffective, unable to abandon their investment in the strategy.
Social Proof and Herd Mentality
The widespread use of moving averages creates a powerful social proof effect. When everyone is using similar indicators, it reinforces the belief that they must be effective. This herd mentality prevents critical evaluation and perpetuates the use of suboptimal tools across the trading community.
The Psychology of Denial
Research in trading psychology reveals common denial patterns among moving average users:
- Attributing losses to “bad luck” rather than flawed methodology
- Focusing on rare successful trades while ignoring frequent failures
- Constantly adjusting parameters instead of questioning the approach
- Seeking validation from other users rather than objective analysis
Breaking Free from Psychological Traps
Overcoming these psychological barriers requires conscious effort and systematic approach. Successful traders learn to separate emotional attachment from objective analysis, regularly questioning their assumptions and remaining open to alternative methodologies that better align with market realities.
Key to Psychological Freedom
The most successful traders treat their indicators as tools, not crutches. They remain emotionally detached from any single methodology and continuously evaluate the effectiveness of their approach based on objective performance metrics rather than psychological comfort.
Scientific Evidence: Academic Research on Moving Average Limitations
The financial academic community has extensively studied moving averages, and the results are far from encouraging. Multiple peer-reviewed studies have consistently shown that moving averages not only fail to predict market movements but often lead to systematic losses when used as the primary trading tool.
Key Research Findings
A comprehensive study by Bessembinder and Chan (1998) published in Financial Management analyzed over 25 years of market data and found that simple moving average strategies consistently underperformed buy-and-hold strategies after accounting for transaction costs. The research revealed that while moving averages might show short-term gains, they fail to capture long-term market trends effectively.
The Efficient Market Hypothesis (EMH) provides a theoretical framework for understanding why moving averages fail. If markets are even semi-strong form efficient, then historical price information (which moving averages are based on) should already be reflected in current prices. This means that any trading strategy based solely on past price movements, including moving averages, should not consistently generate excess returns.
Behavioral Finance Perspective
Behavioral finance research has shown that the apparent success of moving averages in backtesting often results from data mining bias and survivorship bias. Traders tend to remember the few successful trades while forgetting the many small losses that accumulate over time. This creates a psychological illusion of effectiveness that doesn’t match mathematical reality.
Academic research consistently shows that when transaction costs are properly accounted for, moving average strategies become significantly less profitable. The frequent trading signals generated by moving averages result in higher brokerage fees, spreads, and slippage costs that erode any potential profits.
Smart Alternatives: Beyond Traditional Moving Averages
While traditional moving averages have proven inadequate, the financial industry has developed several sophisticated alternatives that address the fundamental flaws of lagging indicators. These modern approaches combine multiple data sources, advanced mathematics, and real-time market sentiment to provide more accurate and timely trading signals.
Adaptive moving averages adjust their sensitivity based on market volatility and trending strength. Unlike traditional moving averages that use fixed periods, adaptive versions speed up during trending markets and slow down during consolidation phases. The Kaufman Adaptive Moving Average (KAMA) and Variable Index Dynamic Average (VIDYA) are prime examples of this approach.
How Adaptive Moving Averages Work
These indicators calculate an efficiency ratio that measures how much price movement is directional versus random. When markets are trending strongly, the adaptive moving average becomes more responsive. During choppy conditions, it becomes smoother to filter out noise. This approach significantly reduces whipsaws and false signals.
Volume-weighted moving averages (VWMA) incorporate trading volume into their calculations, giving more weight to price movements that occur on higher volume. This approach recognizes that price moves supported by high volume are more significant than those occurring on low volume. The Volume-Weighted Average Price (VWAP) is widely used by institutional traders for this reason.
Professional traders rarely rely on single indicators or timeframes. Multi-timeframe analysis involves examining price action across different time horizons simultaneously. This approach helps identify the primary trend direction while finding optimal entry and exit points on shorter timeframes. It’s particularly effective for reducing the impact of random market noise.
Modern trading platforms increasingly incorporate machine learning algorithms that can identify complex patterns in market data that traditional indicators miss. These systems can process multiple variables simultaneously, including price action, volume, volatility, sentiment data, and even news flow to generate more accurate trading signals.
AI-Powered Trading Systems
Advanced AI systems can adapt to changing market conditions in real-time, learning from both successful and unsuccessful trades. They can identify regime changes, adjust their parameters automatically, and even incorporate alternative data sources like social media sentiment, satellite imagery, and economic indicators to make more informed decisions.
Instead of relying on lagging indicators, market structure analysis focuses on how price interacts with key levels of support and resistance, supply and demand zones, and market participant behavior. This approach emphasizes understanding the underlying forces driving price movement rather than simply following mathematical formulas.
Conclusion: Building Better Trading Strategies
The evidence is clear: traditional moving averages are inadequate tools for modern trading. Their lagging nature, susceptibility to false signals, and poor performance in volatile markets make them unsuitable as standalone trading indicators. However, this doesn’t mean that all trend-following approaches are flawed—it simply means that traders need to evolve beyond outdated methods.
Key Takeaways for Successful Trading
- Diversify your analytical approach: Use multiple indicators and timeframes rather than relying on a single tool
- Understand market context: Consider overall market conditions, volatility, and economic environment
- Incorporate volume analysis: Price movements without volume confirmation are often unreliable
- Focus on risk management: No indicator is perfect, so proper position sizing and stop-loss strategies are crucial
- Stay updated with technology: Modern trading tools offer significant advantages over traditional methods
Successful trading in today’s markets requires a comprehensive approach that combines multiple analytical techniques, proper risk management, and continuous learning. While moving averages may serve as one component of a broader trading system, they should never be the sole basis for trading decisions.
Building a Robust Trading System
A well-designed trading system incorporates multiple confirmation signals, adapts to changing market conditions, and maintains strict risk management protocols. It should include fundamental analysis, technical analysis, sentiment analysis, and proper money management techniques. Most importantly, it should be thoroughly backtested and continuously monitored for performance.
For traders looking to move beyond moving averages, start by educating yourself on modern analytical techniques. Practice with paper trading before risking real money, and always maintain realistic expectations about trading performance. Remember that consistent profitability in trading requires patience, discipline, and continuous improvement—qualities that no single indicator can provide.
Important Disclaimer
This analysis is for educational purposes only and should not be considered as financial advice. Trading involves significant risk of loss, and past performance does not guarantee future results. Always consult with qualified financial professionals before making investment decisions and never trade with money you cannot afford to lose.