Compound Chart Patterns: The Art of Combining Patterns for Increased Profitability
Compound Chart Patterns: The Art of Combining Patterns for Increased Profitability
Most traders rely on basic chart patterns such as head and shoulders, double tops and bottoms, and triangles to make trading decisions. But what if we told you that combining these patterns could significantly enhance the accuracy of your predictions and increase the profitability of your trades? In this article, we’ll explore the world of compound chart patterns – complex combinations of multiple patterns appearing together – and how professional traders can use them to achieve exceptional results.
“When multiple patterns appear in the same price area and their signals align, it’s like a double green light for the trader. Opportunities supported by compound patterns are up to 70% more reliable than relying on a single pattern alone.”

Why Are Compound Patterns More Effective?
Compound chart patterns represent collections of different technical patterns that appear in the same price area or timeframe. When the signals from these patterns align, they provide double confirmation for the expected trend, increasing the probability of trade success.

The basic patterns that form the building blocks of compound patterns
Advantages of Relying on Compound Patterns:
- Double Confirmation: When signals from multiple patterns align, the confidence level in the signal is higher
- Reduced False Signals: It’s difficult to generate false signals from multiple synchronized patterns
- Precise Target Setting: Multiple pattern targets can be used to establish precise exit strategies
- Deeper Understanding of Market Dynamics: Compound patterns reflect complex interactions between buyers and sellers
- Competitive Edge: Most traders focus on a single pattern, giving compound pattern analysts an advantage
Studies have shown that compound pattern trades achieve a success rate ranging from 65% to 78% compared to 45% to 55% for individual patterns, making them a powerful tool in the professional trader’s arsenal.
Most Famous Compound Chart Patterns and How to Identify Them
Let’s explore some of the strongest compound patterns that can appear in financial markets, with detailed explanations of how to identify them and utilize them in trading strategies.
1. Head and Shoulders Inside Cup and Handle
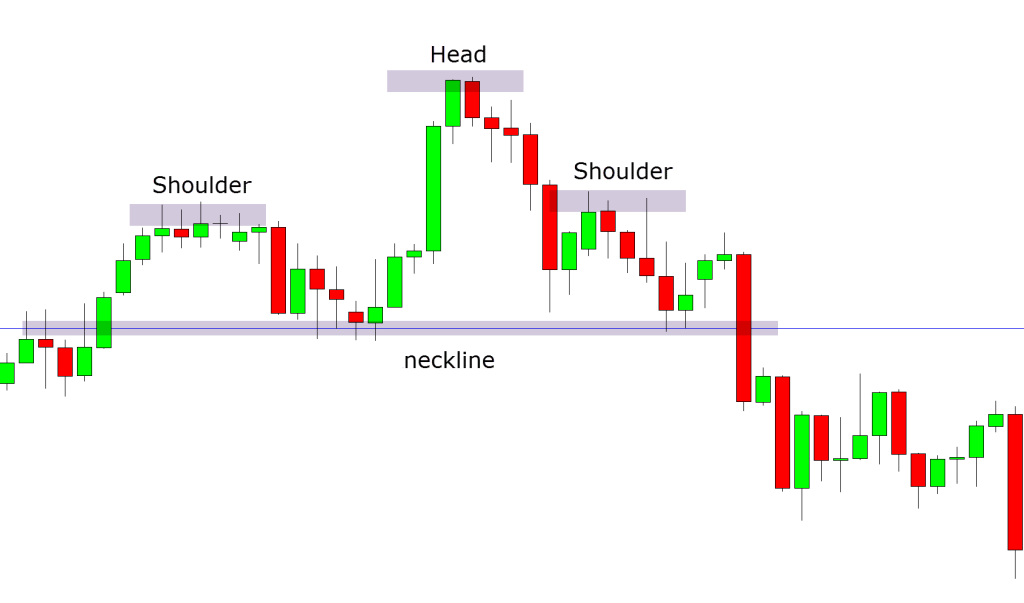
This pattern forms when a head and shoulders pattern appears inside the bottom of a cup and handle. It’s considered one of the strongest bullish reversal signals, providing precise entry points with an excellent risk/reward ratio.
How to Identify: Look for a clear cup and handle pattern, then check if the bottom forms an inverse head and shoulders pattern.
2. Triangle Inside a Price Channel

When a triangle pattern (symmetrical, ascending, or descending) forms within a price channel, it often indicates an imminent breakout in the direction of the underlying channel, providing an excellent opportunity to capitalize on a strong price movement.
How to Identify: First identify a clear price channel, then look for a triangle forming within it, especially before the triangle is 75% complete.
3. Flag Pattern Inside Elliott Wave

This pattern appears when a flag or pennant pattern forms in the fourth wave of an Elliott Wave pattern. It’s a strong signal for the continuation of the prevailing trend, providing an excellent opportunity to enter before the powerful fifth wave.
How to Identify: Identify waves 1 through 3 in the Elliott Wave sequence, then look for a flag or pennant pattern forming as the fourth wave.
4. Doji at Fibonacci Levels with RSI Divergence
This pattern forms when a doji candle (or evening/morning star) appears near a key Fibonacci level, along with a divergence in the Relative Strength Index (RSI). This compound pattern provides a very strong reversal signal.
Success Rate: Statistics show this pattern has a success rate of up to 82% when all three conditions are met.
5. Double Bottom with ABC Correction
:max_bytes(150000):strip_icc()/inverse-head-and-shoulders-4194370-1-4cbe97fa488942a79e874221dcc6d8ab.jpg)
This pattern occurs when price forms a double bottom (W) and the correction between them aligns with an ABC wave correction pattern. This compound pattern provides strong signals for bullish reversal with precise target setting.
Price Target: The first target can be calculated by measuring the depth of the pattern and adding it to the breakout point, while the extension of wave C provides additional targets.
Compound Patterns Comparison Table
| Compound Pattern | Success Rate | Average Risk/Reward | Optimal Timeframe | Typical Completion Duration |
|---|---|---|---|---|
| Head and Shoulders Inside Cup and Handle | 76% | 1:3.2 | Daily and Weekly | 3-6 months |
| Triangle Inside Price Channel | 68% | 1:2.5 | Hourly to Daily | 2-6 weeks |
| Flag Pattern Inside Elliott Wave | 72% | 1:2.8 | 4-hour to Weekly | 1-3 months |
| Doji at Fibonacci Levels with RSI Divergence | 82% | 1:3.5 | All timeframes | 1-5 trading sessions |
| Double Bottom with ABC Correction | 74% | 1:3.0 | Daily and Weekly | 1-4 months |
*Success rates based on analytical studies of major financial markets between 2018-2023
Trading Strategies Using Compound Patterns
Integrated strategy for trading with the compound Cup and Handle pattern
Steps to Building an Integrated Strategy:
- Identify the Primary Pattern First: Start by identifying the larger pattern such as a price channel or Elliott Waves
- Look for the Secondary Pattern: Within the primary pattern, identify smaller patterns that are forming
- Confirm with Technical Indicators: Use indicators such as volume, RSI, or MACD for confirmation
- Set Precise Entry Points: Determine the entry point based on the completion of the secondary pattern
- Establish Logical Stop Loss: Place the stop loss below the lowest support or above the highest resistance within the pattern
- Set Multiple Targets: Use the smaller pattern targets for partial exits and the larger pattern for the final exit
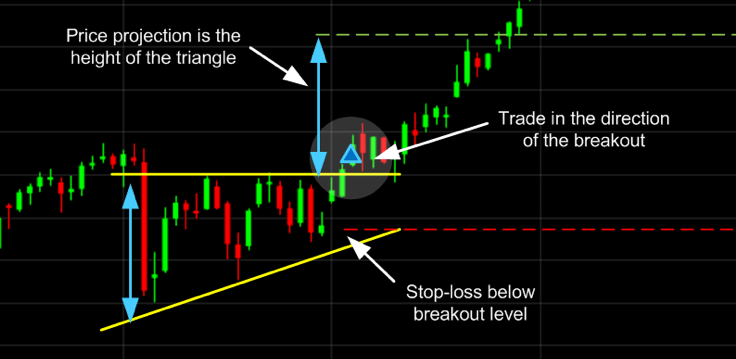
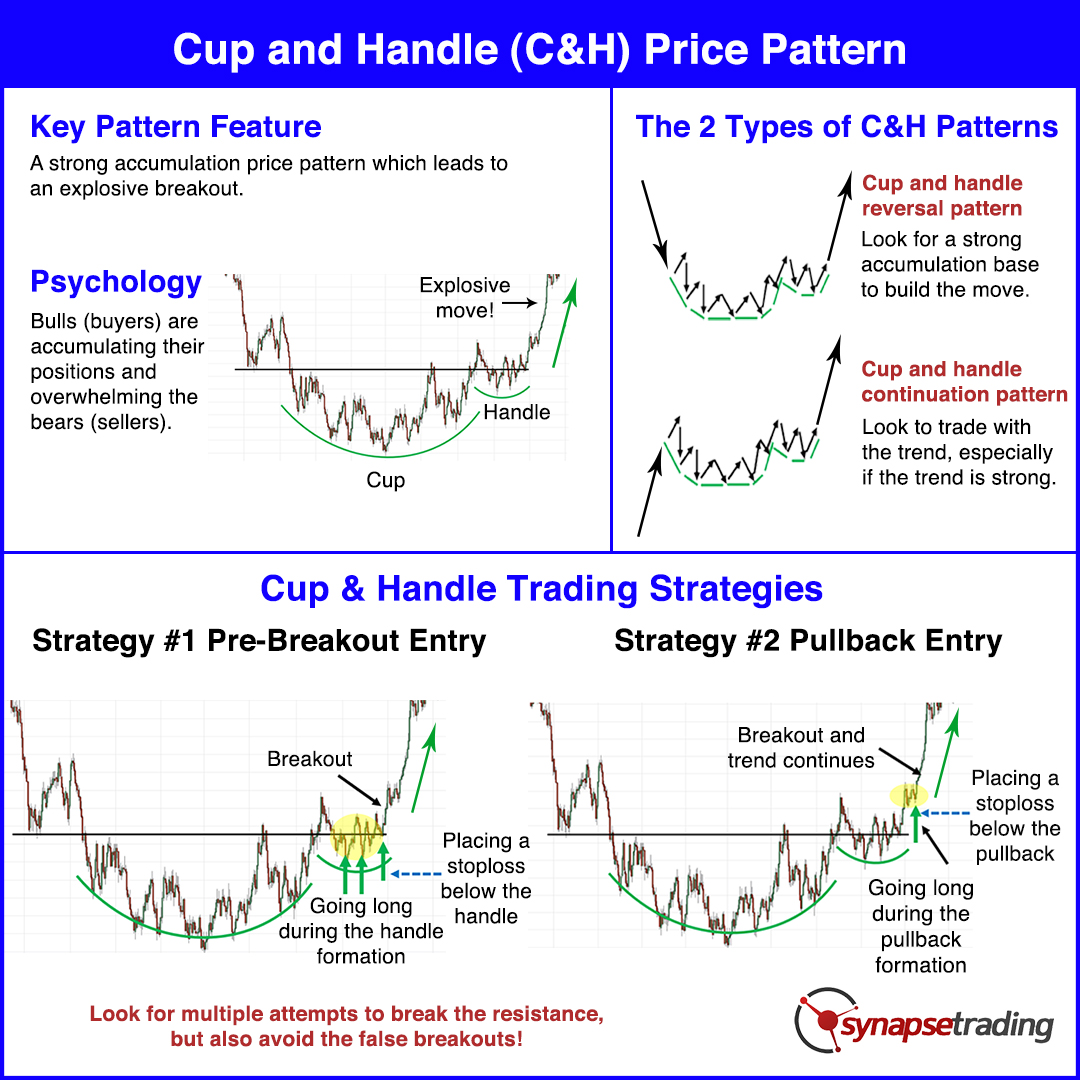
Practical Example: Cup and Handle with Ascending Triangle
Imagine you’ve identified a Cup and Handle pattern on the daily timeframe. During the formation of the handle, you notice an ascending triangle forming. The trading strategy here is:
- Entry: Upon the upward breakout of the ascending triangle
- Stop Loss: Below the last bottom of the triangle
- First Target: Rise equal to the width of the triangle (partial exit)
- Final Target: Rise equal to the depth of the cup (complete exit)
Dual Momentum Strategy
This strategy relies on combining a price pattern such as a wedge or triangle with a divergence in the Moving Average Convergence Divergence (MACD) or Relative Strength Index (RSI).
Key: Look for positive or negative divergence in the technical indicator that coincides with the completion of the price pattern, providing a more accurate entry signal.
Key Levels Confirmation Strategy
This strategy focuses on compound patterns that form near key support or resistance levels or important Fibonacci levels.
Key: Look for reversal patterns such as inverse head and shoulders or double bottom at Fibonacci 61.8% or 78.6% levels.
Multiple Timeframe Strategy
This strategy combines a pattern on a larger timeframe (such as daily) with a confirmatory pattern on a smaller timeframe (such as hourly).
Key: Identify a major trend on the larger timeframe, then use patterns on smaller timeframes to determine precise entry points.
Case Studies: Compound Patterns That Led to Major Price Movements
Case Study #1: Inverse Head and Shoulders Inside a Descending Channel
In the first quarter of 2023, a major technology company’s stock formed a clear inverse head and shoulders pattern inside a descending channel that had persisted for 8 months. Key features of this compound pattern:
- The inverse head and shoulders formed near the lower boundary of the descending channel
- The neckline breakout coincided with breaking the upper boundary of the descending channel
- The breakout was confirmed by a significant increase in trading volume (3 times the average)
- The pattern’s price target was fully achieved within 6 weeks with a 42% rise
Lesson Learned: Bullish reversals are stronger when they coincide with breaking a descending channel boundary, especially with volume confirmation.
Case Study #2: Symmetrical Triangle Inside Cup and Handle
:max_bytes(150000):strip_icc()/CupandHandleDefinition1-c721e47fd1f7451997d0d5d941f6e174.png)
In mid-2022, a symmetrical triangle pattern appeared inside the “handle” of a cup and handle pattern on the chart of a major currency pair. Important details:
- The cup formation took about 3 months, while the handle took 3 weeks
- The symmetrical triangle appeared in the final stage of the handle, indicating a narrowing trading range
- The upward breakout of the triangle accelerated the bullish movement
- The signal was confirmed by a positive divergence in the MACD indicator
- The resulting price movement reached an 18% gain over the following two weeks
Lesson Learned: Triangles within larger patterns often act as catalysts for the expected price movement of the larger pattern.
Case Study #3: Ascending Channel with Consecutive Flags
- Ascending channel continuing for 7 months
- Three consecutive flag patterns during the uptrend
- Each flag pattern aligned with a 38.2% Fibonacci retracement
- Average rise after each flag pattern: 15%
- Confirmation of each pattern with a bullish crossover of moving averages
This case demonstrates the power of multiple continuation patterns within a strong primary trend. Traders who were able to identify these patterns could enter multiple times in the same direction, multiplying their returns while significantly reducing risk.
Lesson Learned: In strong trends, look for consecutive continuation patterns to enter after each correction. This strategy allows maximizing the benefit from the larger trend while reducing risk.
Challenges and Common Mistakes in Identifying Compound Patterns
Main Challenges
- Increased Complexity: Identifying multiple overlapping patterns requires greater expertise and skill
- Interpretation Doubt: When signals from different patterns conflict, it can be difficult to decide which to follow
- Need for Greater Patience: Compound patterns take longer to form and complete
- Sudden Market Fluctuations: Can disrupt compound patterns in formation
- Fewer Opportunities: Clear compound patterns are less frequent than simple patterns
Common Mistakes and How to Avoid Them
- Seeing Non-existent Patterns: Avoid over-analyzing the chart
- Ignoring the Broader Context: Make sure to consider the general market trend
- Not Waiting for Confirmation: Always wait for pattern completion and breakout before trading
- Neglecting Trading Volume: Ensure that volume supports the pattern signal
- Relying on a Single Timeframe: Verify patterns across multiple timeframes
“Don’t look for perfect compound patterns; they are very rare. Instead, look for patterns that meet 80% of the criteria with strong confirmations from technical indicators and volume. Methodology and discipline are more important than perfection.”
– Professional trader with 25 years of experience
Practical Steps to Master Compound Pattern Analysis
1. Building Knowledge Foundation
- Master individual pattern analysis first
- Learn characteristics of each pattern and its success statistics
- Study potential relationships between different patterns
- Understand how volume interacts with different patterns
- Learn complementary technical indicators for each pattern