False Breakout Trading Strategy: How to Profit from Liquidity Traps in Markets
False Breakout Trading Strategy: How to Profit from Liquidity Traps in Markets
Traders in financial markets face a common and confusing phenomenon known as “false breakouts” or “price traps.” This phenomenon occurs when the price breaks an important support or resistance level, suggesting the beginning of a new trend, then suddenly reverses its movement and returns in the opposite direction. What seems like a clear signal to enter a trade quickly turns into a trap that causes traders to incur losses.
“The most profitable opportunities in financial markets exist where most traders make mistakes. False breakouts are not just a source of frustration, but golden opportunities if you learn how to recognize and exploit them.”
Understanding False Breakouts: Why Do They Happen in Markets?
To understand the false breakout trading strategy, we first need to understand why this phenomenon occurs. Contrary to popular belief, false breakouts are not just “noise” in the market or random movements, but they are an intentional part of the market mechanism and are often driven by the activities of major players in the market.
False breakouts represent “liquidity traps” – an organized process where market giants try to trap smaller traders to clear stop-loss orders and collect liquidity before moving the price in the intended direction.
Main Causes of False Breakouts
- Stop Hunting
- Testing major support and resistance levels
- Liquidating highly leveraged traders
- Gathering liquidity before major price movements
- Testing the strength of the general market trend
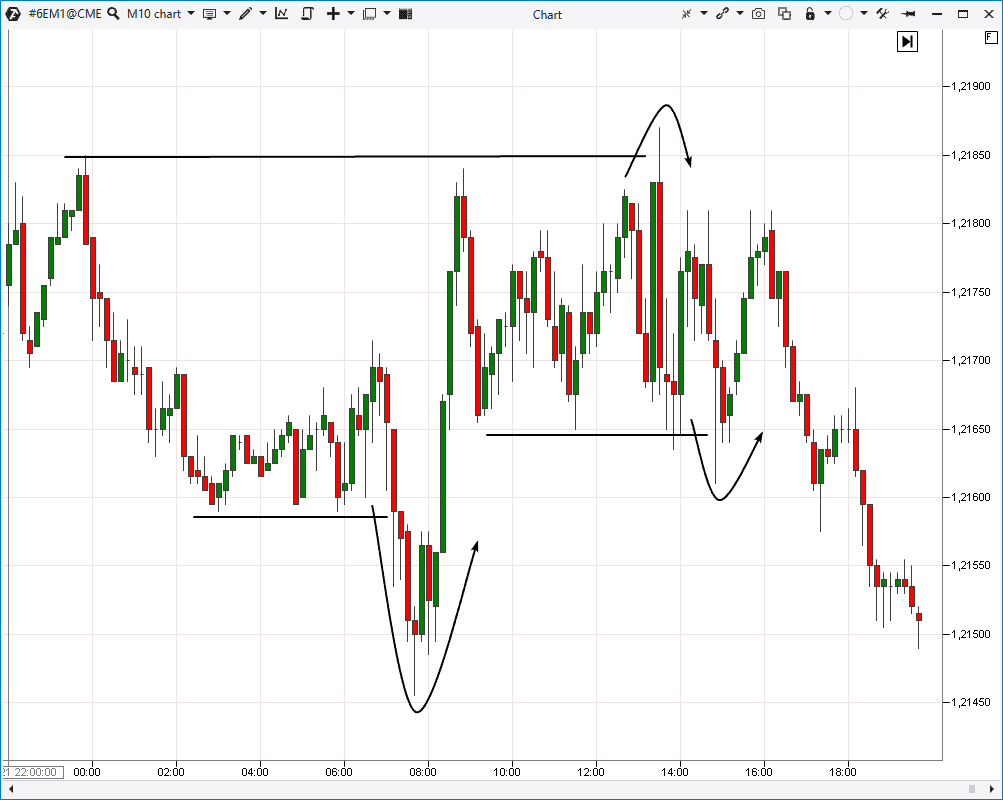
Example of a liquidity trap where major players target stop-loss orders before moving the price in the intended direction
How Are Liquidity Traps Created?
The process begins when major players (large banks, market makers, and financial institutions) need to trade large quantities of assets. But the problem they face is: how can they execute huge trades without causing a large price movement that harms their interests?
The solution: Look for areas in the market that contain sufficient liquidity (collection of buy and sell orders) to absorb their huge transactions. This liquidity can often be found in areas where stop-loss orders cluster, especially at clear support and resistance levels or at important psychological levels.
“Market makers don’t trade against the market, they trade against individual traders. Their goal is not to cause you to lose, but to get the liquidity needed to execute their large trades at the best prices.”
“When you understand the liquidity collection mechanism, you’ll realize that false breakouts are not your enemy but valuable signals to determine the intentions of major players.”
How to Identify Potential False Breakouts
Learn the signs that help identify false breakouts before or during their occurrence. These indicators collectively increase the likelihood of accurately identifying false breakouts and turning them into profitable trading opportunities.
1. Examine Price Momentum
True breakouts are usually accompanied by strong momentum, while false breakouts lack this momentum.
- Weak breakout with small candles
- Price slowdown immediately after breakout
- Absence of supporting trading volume
2. Monitor Trading Volumes
Trading volume is a key indicator to confirm the validity or falsity of a breakout.
- Breakout with low trading volume = high probability of false breakout
- Increased trading volume after breakout when reversing = confirmation of false breakout
- Gradual decrease in volume during breakout = warning sign

Typical false breakout pattern: breakout of a key level, then immediate reversal and cancellation of the breakout
3. Identify Potential Areas for Liquidity Traps
- Historical support and resistance levels
- Important psychological levels (such as round numbers)
- Key Fibonacci levels
- Previous prominent tops and bottoms
- Areas where stop-loss orders accumulate (especially at obvious levels)
4. Check Japanese Candlestick Formations
- Bearish/Bullish Engulfing pattern
- Evening/Morning Star
- Inverted Hammer
- Doji candle immediately after breakout
- Pin Bar indicating trend reversal
5. Use Technical Indicators for Confirmation
- Negative/positive divergence in Relative Strength Index (RSI)
- Non-confirmation of breakout from MACD indicator
- Overbought/oversold levels in the Stochastic oscillator
- High trading volume that doesn’t align with price direction
- Moving averages not aligning with breakout direction

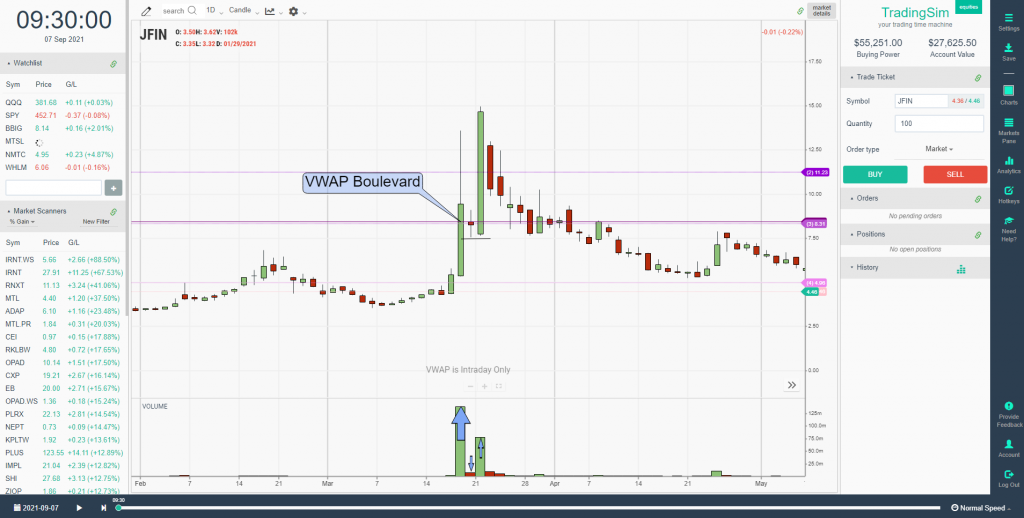
Chart analysis showing how to identify liquidity traps and false breakouts using supply and demand zones
Common Patterns of False Breakouts
1. False Breakouts Above Resistance
Price breaks the resistance level briefly, targeting buy stop orders, then returns below resistance again. This pattern is sometimes called “phantom breakout” or “bullish fake-out.”
2. False Breakouts Below Support
Price breaks the support level briefly, targeting sell stop orders, then bounces back above the support level. Sometimes called “sellers’ trap” or “bearish fake-out.”
False Breakout Trading Strategies
After understanding what false breakouts are and how to identify them, it’s time to learn how to turn them into profitable trading opportunities. Here are three effective strategies that can be used to take advantage of false breakouts in financial markets.
1. “Reversal Hunter” Strategy
This strategy focuses on waiting for a false breakout to occur and then entering in the opposite direction when the first reversal signals appear.
Entry Signal:
- Breakout of an important support/resistance level
- Appearance of a reversal pattern (Pin Bar/Doji/Reversal candle)
- Decrease in momentum (divergence in indicators)
Stop Loss:
Just behind the new high/low with a small margin
Profit Target:
- The level from which the breakout started
- Previous support/resistance levels
2. “Retest Method” Strategy
After a false breakout occurs and price returns, the price often retests the breached level again. This strategy takes advantage of this phenomenon.
Entry Signal:
- Wait for the false breakout and return behind the level
- Enter when retesting the breached level
- Confirm the signal with a positive candle pattern
Stop Loss:
Below/above the candle that gave the entry signal
Profit Target:
- 61.8% Fibonacci level of the breakout movement
- The next support/resistance level
3. “Double Trap” Strategy
This strategy takes advantage of consecutive false breakouts in opposite directions, indicating market hesitation before taking a strong direction.
Entry Signal:
- False breakout in one direction
- Then false breakout in the opposite direction
- Enter in the direction of the first breakout after the second breakout fails
Stop Loss:
Behind the level of the second false breakout
Profit Target:
- The distance between the two false breakouts
- 161.8% Fibonacci level of the price range
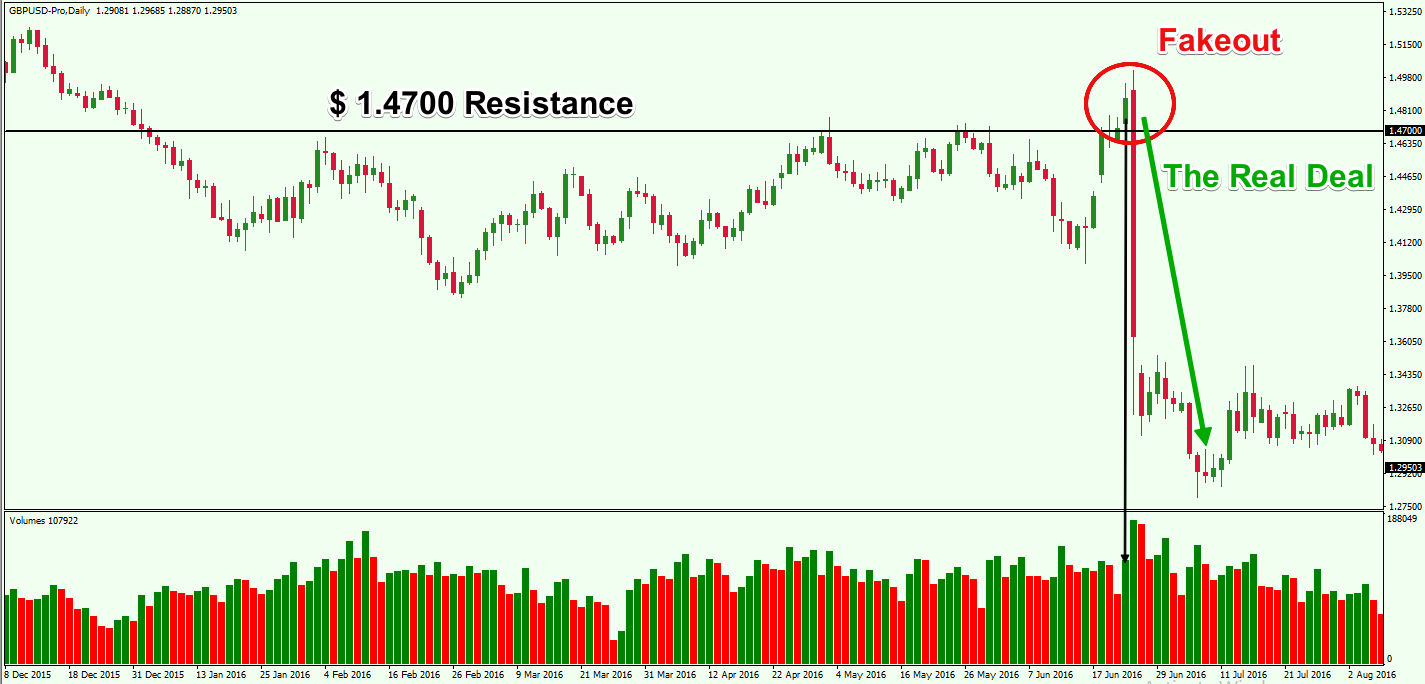
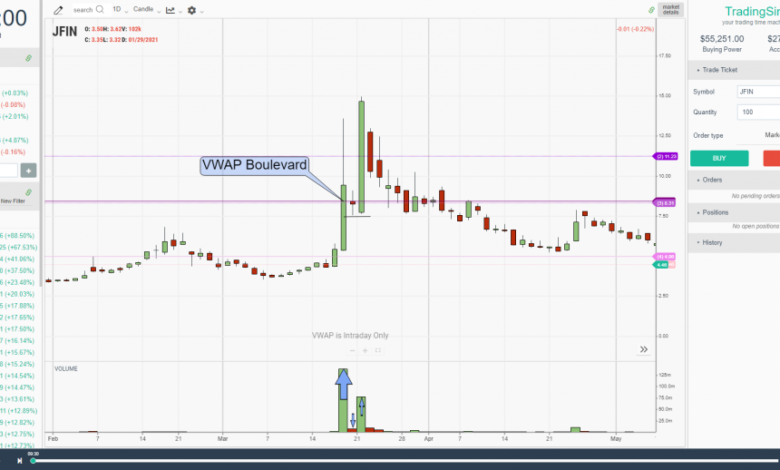
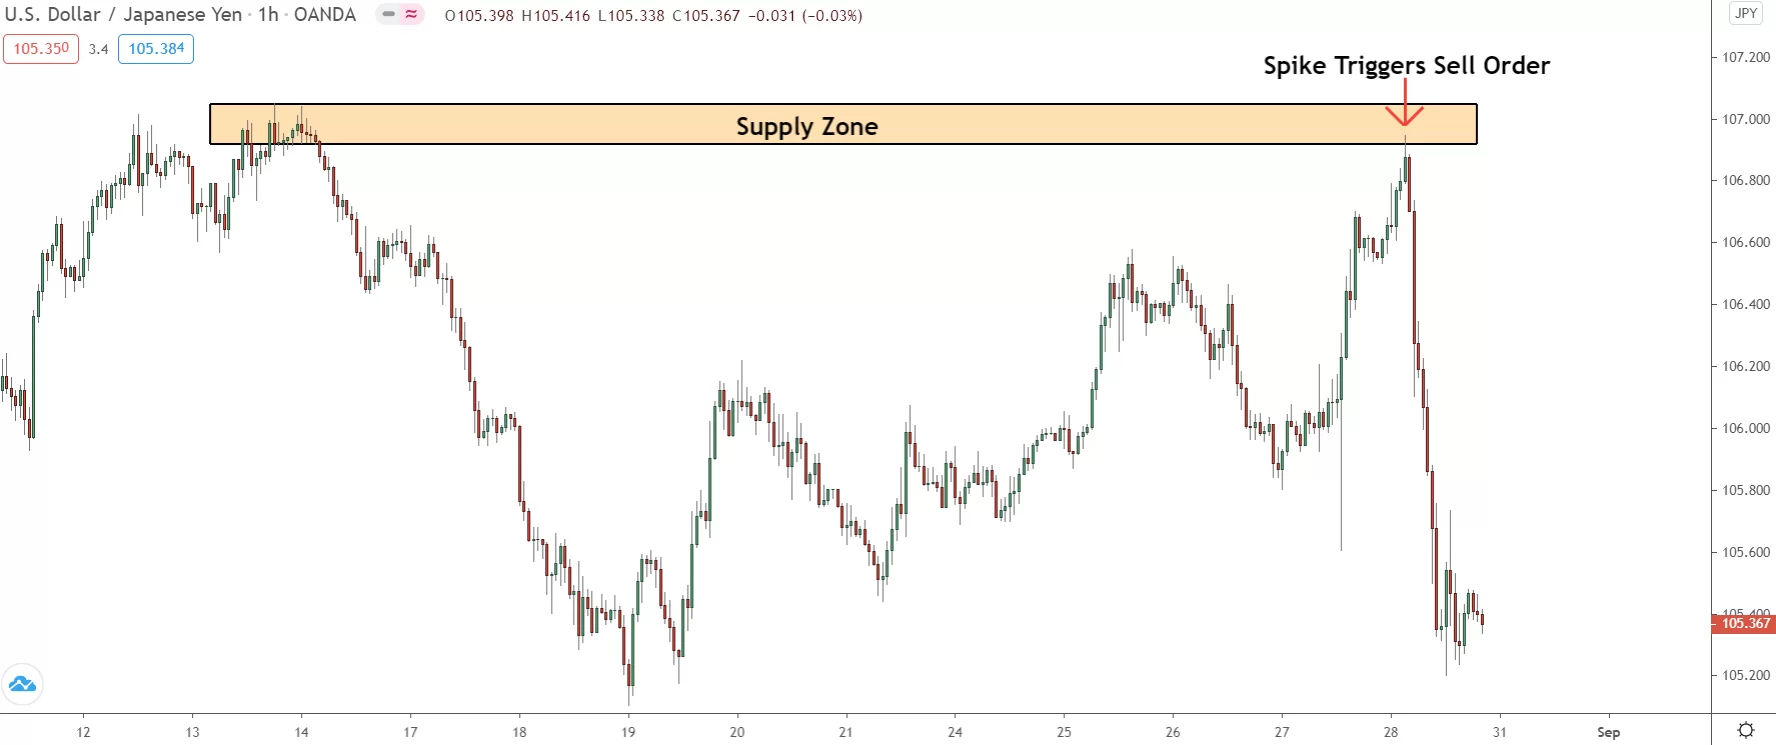
Practical example of a false breakout trading strategy: temporarily breaking resistance level, then reversing movement and starting a downtrend
Enhancing False Breakout Strategy
Filter Signals Using:
- Multiple timeframe analysis (confirmation from larger timeframes)
- Signal synchronization with the general market trend
- Presence of divergence in technical indicators
- Weak momentum during breakout (measured by RSI)
- Only entering in areas with a good risk/reward ratio (at least 1:2)
Ideal Times to Look for False Breakouts:
- Beginning of main trading sessions (London/New York)
- Before/after important economic data releases
- At psychological levels (round numbers)
- During correction periods of strong trends
- When price approaches clear and defined supply/demand zones
Comparison Between Types of False Breakout Strategies
| Strategy Type | Expected Success Rate | Risk/Reward Ratio | Preferred Timeframe | Suitable Markets |
|---|---|---|---|---|
| Reversal Hunter | 55-60% | 1:2 to 1:3 | 4 hours and daily | Forex, Stocks, Indices |
| Retest Method | 65-70% | 1:1.5 to 1:2 | Hourly and 4 hours | Forex, Futures |
| Double Trap | 50-55% | 1:3 to 1:5 | Daily and weekly | Indices, Forex, Commodities |
Case Studies: Successful Examples of False Breakout Trading
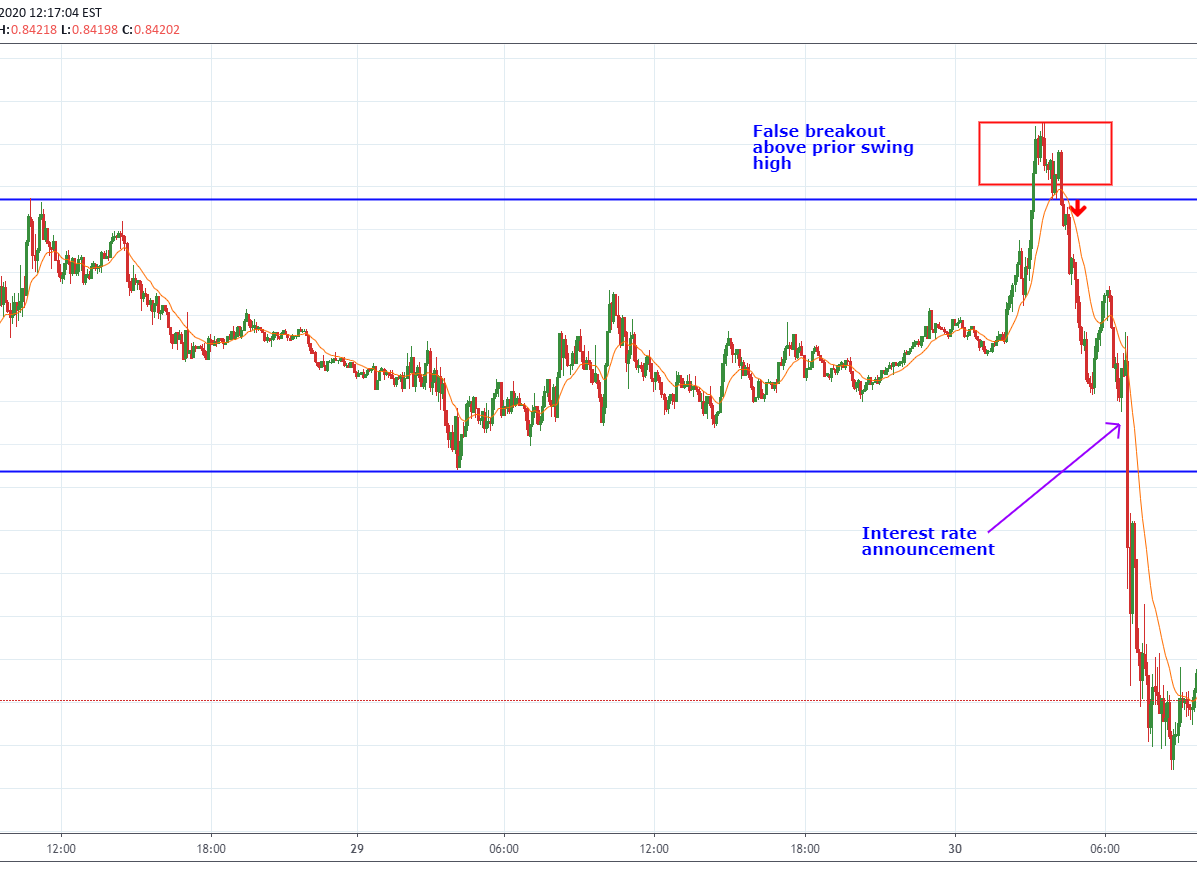
Case Study #1: False breakout in EUR/GBP pair on the daily timeframe
Case Study #1: Bullish False Breakout Turns into a Selling Opportunity
In this example, we observe the formation of a symmetrical triangle pattern on the EUR/GBP pair. After a consolidation period, the price broke through the upper limit of the triangle, suggesting the beginning of a new uptrend. However, several warning signs appeared:
- Low trading volume during the breakout
- Formation of a doji candle immediately after the breakout
- Negative divergence in the RSI indicator
- The breakout was close to an important historical resistance level
Two days after the breakout, the price returned below the triangle line, confirming the false breakout. A sell position was entered with a stop loss above the last peak, and a profit target of 1:3 risk/reward ratio was achieved.
Case Study #2: Bearish False Breakout in an Uptrend Market
In this example, a major technology company stock was in a strong uptrend, but it entered a correction and broke an important support level, raising fears that the uptrend had ended. However, there were several signals indicating that this break might be deceptive:
- The break occurred after a 38.2% Fibonacci correction (a normal correction level)
- A hammer candle formed immediately after the break
- Positive divergence appeared in the MACD indicator
- The break happened at an important technical support level (the 50-day moving average)
Two days after the break, the price bounced back above the broken support level. A buy position was entered with a stop loss below the last bottom. Impressively, the stock resumed its uptrend strongly, achieving returns exceeding 25% in the following months.

Case Study #2: Bearish false breakout turns into a strong buying opportunity
False Breakout Strategy Results Statistics
Strategy Test Results (100 Trades)
- Winning Trades Rate: 67% of total trades
- Average Profit/Loss: 1:2.1 (for winning vs. losing trades)
- Net Return: 2.4% monthly on risked capital
- Maximum Drawdown: 11.3% of account
- Sharpe Ratio: 1.8 (good risk/return ratio)
Most Effective Markets
- Forex: Major and cross currency pairs (72% success rate)
- Stocks: High liquidity stocks (65% success rate)
- Commodities: Gold and oil (64% success rate)
- Indices: S&P 500 and Nasdaq (68% success rate)
- Futures: Index futures (70% success rate)
Risk Management in False Breakout Trading
Although the false breakout trading strategy can be highly profitable, it requires precise risk management. False breakouts are inherently volatile, and distinguishing between false and genuine breakouts is not always clear.
“The difference between a successful and unsuccessful trader is not in the entry strategy, but in how the trade is managed after entry. Discipline in risk management is what transforms the false breakout strategy from risky to sustainably profitable.”
Basic Risk Management Rules
- Never risk more than 1-2% of capital on any single trade
- Define entry and exit points precisely before starting the trade
- Always use stop-loss orders, and place them in logical positions
- Look for opportunities with a risk/reward ratio of at least 1:2
- Split large trades into parts and close parts upon achieving partial targets
Advanced Risk Management Techniques
- Use trailing stop losses after price moves in the expected direction
- Reduce trade size in highly volatile markets
- Use “smart stop points” based on price structures instead of fixed points
- Avoid trading before major economic events or company earnings
- Gradually increase trade size as the trend confirms (pyramiding)
Example of appropriate stop loss placement when trading a false breakout in a supply zone
Common Mistakes and How to Avoid Them
- Rushing to identify false breakouts: Wait for clear confirmation before entering
- Setting too tight stop losses: Make sure to place stop losses outside the normal fluctuation range
- Ignoring the general market context: Check the general trend before trading false breakouts
- Overtrading: Wait for excellent opportunities only, don’t trade every potential breakout
- Not respecting warning signals: If false breakout signs don’t appear clearly, avoid the trade
Conclusion and Next Steps
False breakouts are not just “noise” in the markets or a source of frustration for traders, but they are a natural result of market dynamics and the activities of major players. By understanding what these breakouts are, how to identify them, and using appropriate strategies to trade them, traders can transform what many see as a “trick” into a profitable opportunity.
The essential elements for successful false breakout trading are patience to wait for clear signals, discipline in following risk management rules, and experience that comes with continuous practice and learning from each trade. Over time, you’ll develop an “eye” to identify potential false breakouts faster and more accurately.
Steps to Develop Your False Breakout Trading Skills
- Start trading on a demo account and track all potential false breakouts
- Keep a detailed trading log to analyze results and improve performance
- Start with larger timeframes (daily and weekly) before moving to smaller ones
- Focus on a few financial instruments until you understand their behavior well
- Develop your own “checklist” to assess the probability of a false breakout
- Practice identifying potential areas where stop-loss orders cluster
- Study market behavior before and after major economic events
Additional Learning Resources
- Learn to read trading volume and its relationship with breakouts
- Study Japanese candlestick reversal patterns and their applications
- Deepen your understanding of supply and demand zones
- Study market crowd psychology and herd behavior
- Learn about “contrarian” strategies
- Develop skills in identifying important levels on charts
- Take advantage of momentum indicators to confirm false breakout signals
Always remember: The best traders are those who understand the basic market mechanism, not those who follow crowds. False breakouts are not a mistake in the market but part of the game – and the game is the art of collecting liquidity. When you understand this game, you’ll find yourself trading with the big players instead of being their victim.