Why Scalping Strategies Fail?
The Factors That Destroy Scalping Strategies: A Comprehensive Analysis of Why Quick-Profit Trading Fails.
Why Scalping Strategies Fail?
The Factors That Destroy Scalping Strategies: A Comprehensive Analysis of Why Quick-Profit Trading Fails
Critical Trading Reality
Recent studies reveal that over 85% of scalping strategies fail within the first six months, with traders losing substantial capital. The promise of quick profits masks a brutal reality that destroys trading accounts faster than any other strategy.
The Scalping Illusion: When Quick Profits Turn into Quick Losses
Scalping has captured the imagination of traders worldwide with its promise of rapid-fire profits extracted from minute price movements. The allure is undeniable: making money in seconds or minutes, capitalizing on market volatility, and accumulating small gains that supposedly compound into substantial profits. However, this seductive narrative conceals a harsh reality that has decimated countless trading accounts.
Real statistics showing the devastating failure rates of scalping strategies
What makes scalping particularly dangerous is its deceptive nature. Unlike other chart formations that might show ambiguous signals, scalping appears to offer immediate gratification and clear profit opportunities. This psychological aspect becomes one of the primary reasons for its failure, as market participants pile into positions based on superficial market movements without considering the underlying forces that systematically work against short-term trading strategies.
The financial industry’s promotion of scalping strategies stems from their revenue generation potential, not from empirical evidence of their effectiveness. Brokerages and trading platforms encourage scalping because it generates massive commission volumes while systematically draining trader accounts. Every scalping transaction enriches the broker while moving the trader closer to inevitable ruin.
This comprehensive analysis will dissect the fundamental flaws that make scalping not just unreliable, but actively destructive to trading performance. We’ll explore the hidden costs, psychological traps, and market realities that render these popular strategies obsolete in modern trading environments where institutional algorithms dominate short-term price movements.
Transaction Costs: The Silent Killer of Scalping Profits
The most devastating factor destroying scalping strategies is often the least visible: transaction costs. While traders focus intensely on price movements and technical patterns, they frequently overlook the cumulative impact of spreads, commissions, slippage, and hidden fees that systematically erode every scalping attempt.
Breakdown of transaction costs that destroy scalping profitability
The Spread Trap
Every scalping trade must overcome the bid-ask spread before generating any profit. In liquid markets, spreads might appear minimal, but their impact compounds rapidly with high-frequency trading. A 1-pip spread in EUR/USD might seem negligible, but for a scalper making 50 trades per day, this represents a guaranteed loss of 50 pips that must be overcome before achieving any profitability.
The Spread Mathematics
A scalper targeting 2-pip profits on EUR/USD with a 1-pip spread needs a 50% win rate just to break even, before considering commissions, slippage, or any other costs. The mathematical requirements become impossible when realistic market conditions are factored in.
Commission Compound Effect
Commission structures that appear reasonable for swing trading become devastating for scalping strategies. A $7 round-trip commission on stock trades, perfectly acceptable for positions targeting $500+ profits, becomes a 35% drag on scalping trades targeting $20 profits. This commission burden requires impossibly high win rates to maintain profitability.
Hidden Cost Components
- • Bid-ask spreads on every trade
- • Commission fees (often both ways)
- • Slippage during execution
- • Platform fees and data costs
- • Swap rates for overnight positions
Cumulative Impact
- • Costs compound with trade frequency
- • Higher frequency = higher cost burden
- • Break-even rates become impossible
- • Profit margins erode systematically
- • Account depletion accelerates
Slippage: The Invisible Profit Killer
Slippage represents the difference between expected execution prices and actual fill prices. During volatile periods when scalping opportunities appear most attractive, slippage increases dramatically. Market orders that should fill at displayed prices often execute several pips away from expectations, immediately placing scalping trades at a loss before the market has even moved.
Psychological Warfare: How Scalping Destroys Mental Health
Beyond the mathematical impossibilities, scalping inflicts severe psychological damage that compounds trading failures. The high-stress environment of rapid-fire decision making, combined with the emotional rollercoaster of frequent wins and losses, creates a psychological profile that virtually guarantees long-term failure.

The psychological stress and anxiety that scalping inflicts on traders
The Adrenaline Addiction
Scalping creates an addiction to adrenaline and immediate gratification that mirrors gambling addiction patterns. The rapid succession of trades, each potentially profitable or loss-making within minutes, triggers the brain’s reward system in ways that promote compulsive behavior rather than rational decision-making.
Neurological Impact
Studies show that high-frequency trading patterns alter brain chemistry, increasing cortisol production and decreasing decision-making capabilities. Scalpers often report feeling “addicted” to the charts, unable to step away from trading platforms even during obvious losing streaks.
Decision Fatigue and Mental Exhaustion
The human brain has limited capacity for high-quality decisions. Scalping demands hundreds of rapid decisions daily, each carrying financial consequences. This decision overload leads to progressively deteriorating judgment throughout trading sessions, with later trades showing markedly worse performance than earlier ones.

The mental traits required for trading success that scalping systematically destroys
The Illusion of Control
Scalping provides a dangerous illusion of control over market outcomes. The ability to enter and exit positions rapidly creates false confidence that traders can manage risk through quick reactions. This illusion prevents scalpers from recognizing that they’re participating in a negative expectancy game where the odds are systematically stacked against them.
Psychological Damage
- • Chronic stress and anxiety
- • Sleep disruption from screen time
- • Relationship strain from obsessive behavior
- • Loss of perspective on long-term goals
- • Gambling-like addiction patterns
Performance Impact
- • Deteriorating decision quality
- • Increased emotional trading
- • Revenge trading after losses
- • Over-leveraging from desperation
- • Inability to follow trading plans
The psychological destruction caused by scalping extends beyond trading performance to impact personal relationships, physical health, and overall life satisfaction. Many former scalpers report that quitting this trading style was as challenging as overcoming substance addiction, requiring professional intervention and extended recovery periods.
The Execution Trap: Slippage and Latency Issues
Perfect scalping strategies on paper become disasters in real market execution. The gap between theoretical backtesting results and live trading performance widens dramatically for scalping strategies due to execution challenges that are impossible to replicate in historical testing environments.
The Latency Reality
Every scalping trade competes against institutional algorithms operating with microsecond latencies and direct market access. Retail traders, regardless of their internet connection quality, face latency disadvantages measured in milliseconds—an eternity in scalping timeframes where prices can move significantly before orders reach the market.
How execution delays and slippage destroy scalping strategies in volatile markets
Latency Impact
High-frequency trading firms invest millions in infrastructure to achieve sub-millisecond execution times. Retail scalpers using standard brokers face latencies 100-1000 times slower, making them easy prey for algorithmic systems that can react to the same signals faster.
Slippage Compounding
Slippage affects scalping disproportionately because profit targets are so small that even minor execution deviations can eliminate entire profit margins. A 0.5-pip slippage on a 2-pip profit target represents a 25% reduction in expected returns—before considering that slippage often occurs on both entry and exit orders.
Order Delay
50-200ms typical retail latency
Price Movement
1-5 pips during execution
Profit Erosion
25-50% of expected gains
Algorithmic Competition
Modern markets are dominated by algorithmic trading systems specifically designed to exploit short-term price movements. These systems operate at speeds and scales impossible for human traders, systematically identifying and capitalizing on the same opportunities that scalpers target, but with overwhelming technological advantages that make retail scalping obsolete.
Risk Management Nightmare: Why Traditional Rules Don’t Apply
Scalping strategies create unique risk management challenges that traditional trading wisdom cannot address. The combination of tight profit targets, high frequency trading, and emotional pressure creates scenarios where conventional risk management becomes not just ineffective, but counterproductive.

The complex risk management challenges that make scalping strategies unsustainable
The Stop Loss Dilemma
Scalping requires extremely tight stop losses to maintain acceptable risk-reward ratios. However, these tight stops are frequently triggered by normal market noise rather than genuine adverse price movements. This creates a scenario where profitable strategies are undermined by necessary risk controls, leading to death by a thousand small cuts.
Risk-Reward Mathematics
With 2-pip profit targets and 2-pip stop losses, scalpers need 60%+ win rates to overcome transaction costs. However, tight stops result in 70-80% of trades being stopped out by market noise, making profitable scalping mathematically impossible.
Position Sizing Impossibilities
Standard position sizing rules recommend risking 1-2% of capital per trade. For scalping strategies targeting 2-pip profits with 2-pip stops, this requirement forces position sizes so large that single trades can move the market against the trader, creating artificial slippage and execution problems that compound the strategy’s inherent flaws.
Risk Management Failures
- • Stops triggered by market noise
- • Position sizes too large for scalping
- • Correlation risk from multiple positions
- • Emotional override of risk rules
- • Revenge trading after stop-outs
Compounding Problems
- • Small losses accumulate rapidly
- • Higher frequency = higher risk
- • Correlation between scalping trades
- • Emotional decisions increase risk
- • Account depletion accelerates
Correlation and Concentration Risk
Scalpers often hold multiple positions simultaneously across correlated instruments, unknowingly concentrating risk rather than diversifying it. When market volatility spikes, all scalping positions tend to move adversely together, creating portfolio-wide losses that exceed individual position risk limits and can destroy accounts in minutes.
The Path Forward: Alternatives to Scalping Destruction
Understanding why scalping fails is only valuable if it leads to better trading approaches. The evidence overwhelmingly demonstrates that scalping strategies are mathematically doomed in modern market conditions, but this recognition opens doors to more sustainable and profitable trading methodologies.
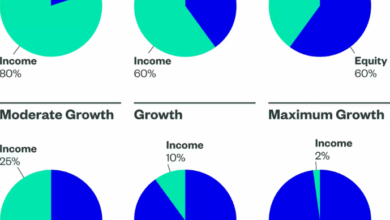
Proven Alternatives
Successful traders focus on longer timeframes where transaction costs become manageable, psychological pressure decreases, and fundamental analysis becomes relevant. Swing trading and position trading offer superior risk-adjusted returns without the destructive elements of scalping.
Sustainable Trading Principles
Winning Strategies
- • Longer timeframe analysis
- • Manageable transaction costs
- • Reduced psychological pressure
- • Fundamental analysis integration
- • Sustainable risk management
Professional Approach
- • Patient capital deployment
- • Quality over quantity trades
- • Comprehensive market analysis
- • Long-term wealth building
- • Stress-free trading lifestyle
Final Wisdom: Escaping the Scalping Trap
The transition away from scalping requires both intellectual understanding of its flaws and emotional acceptance that quick profits are illusory. Successful traders who abandon scalping often report immediate improvements in both trading performance and quality of life, as they escape the stress and mathematical impossibility of high-frequency profit-seeking.
Remember that the market’s primary function is to transfer wealth from the impatient to the patient, from the emotional to the disciplined, and from those seeking quick profits to those building sustainable strategies. Scalping failure is not a personal shortcoming—it’s a mathematical certainty that can be avoided by choosing strategies aligned with market realities rather than fantasy profit promises.
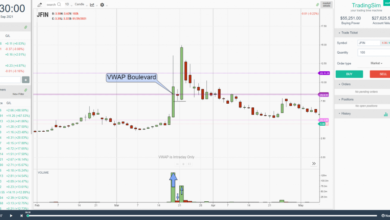
Technical Analysis Limitations in Ultra-Short Timeframes
Technical analysis, the cornerstone of scalping strategies, faces unprecedented challenges when applied to ultra-short timeframes. What works on daily or weekly charts becomes virtually useless on 1-minute or 5-minute intervals, yet scalpers continue to rely on these tools with devastating consequences.
:max_bytes(150000):strip_icc()/dotdash_Final_Top_Indicators_for_a_Scalping_Trading_Strategy_Sep_2020-01-c530bea4f4a84a34a89a4d74fdae1be8.jpg)
Traditional technical indicators failing in scalping timeframes
The Noise-to-Signal Problem
In ultra-short timeframes, market noise overwhelms genuine signals. Price movements that appear significant on 1-minute charts often represent nothing more than random fluctuations caused by individual trades, algorithm adjustments, or momentary imbalances in order flow. Traditional technical patterns lose their predictive power when the underlying price movements lack fundamental meaning.
Signal Degradation Facts
Research shows that technical patterns identified on timeframes under 15 minutes have less than 25% reliability compared to 60%+ on daily charts. The shorter the timeframe, the more random the price behavior becomes.
Algorithmic Interference
Modern markets are dominated by algorithmic trading systems that execute thousands of transactions per second. These algorithms create artificial patterns and false breakouts specifically designed to trap manual traders using traditional technical analysis. What scalpers interpret as bullish or bearish signals often represent algorithmic manipulation rather than genuine market sentiment.
Pattern Breakdown
- • Support/resistance levels fail within minutes
- • Chart patterns appear and disappear rapidly
- • Volume analysis becomes meaningless
- • Trend lines break immediately after formation
Indicator Failure
- • RSI oscillates wildly without meaning
- • MACD generates continuous false signals
- • Bollinger Bands provide no reliable boundaries
- • Moving averages lag beyond usefulness
The fundamental problem is that technical analysis was developed for longer timeframes when markets moved more slowly and individual participants had greater impact. In today’s high-frequency trading environment, traditional technical analysis on short timeframes is not just ineffective—it’s counterproductive.
The Broker’s Advantage: How Spreads Crush Scalpers
Brokers love scalpers—not because they help them succeed, but because they provide a steady stream of commission revenue while systematically losing money. The broker’s edge in scalping comes from the mathematical certainty that frequent trading with small profit targets cannot overcome transaction costs over time.

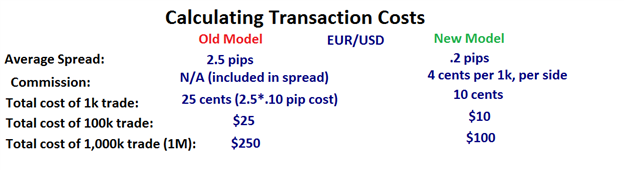
How trading fees accumulate to destroy scalping profits
The Spread Death Spiral
Every scalping trade begins at an immediate disadvantage—the bid-ask spread. Before a position can become profitable, price must move enough to overcome this spread plus any additional commission or fees. For scalpers targeting 5-10 pip moves, a 2-3 pip spread represents 20-60% of the intended profit, creating an insurmountable mathematical disadvantage.
Spread Impact Calculation
Example: EUR/USD Scalping Trade
- • Target profit: 5 pips
- • Typical spread: 1.5 pips
- • Commission: 0.5 pips equivalent
- • Total cost: 2 pips
- • Required accuracy: 70%+ just to break even
Hidden Fee Accumulation
Beyond obvious spreads and commissions, scalpers face numerous hidden costs that compound their disadvantage: slippage on market orders, platform fees, data fees, and financing charges for overnight positions. These seemingly minor costs accumulate rapidly when trading frequently, often consuming 50% or more of gross profits.
Direct Costs
Spreads, commissions, swap fees
Indirect Costs
Slippage, requotes, platform fees
Opportunity Costs
Time, energy, missed opportunities
Professional market makers and ECN providers understand that retail scalpers provide essentially free money through their frequent trading activity. They adjust spreads and execution quality specifically to maximize revenue from this segment while maintaining the illusion of fair trading conditions.
Leverage Addiction: The Road to Account Destruction
Leverage in scalping creates a dangerous psychological trap that destroys more trading accounts than any other single factor. The ability to control large positions with small amounts of capital seduces scalpers into taking increasingly dangerous risks while amplifying the impact of their inevitable losses.
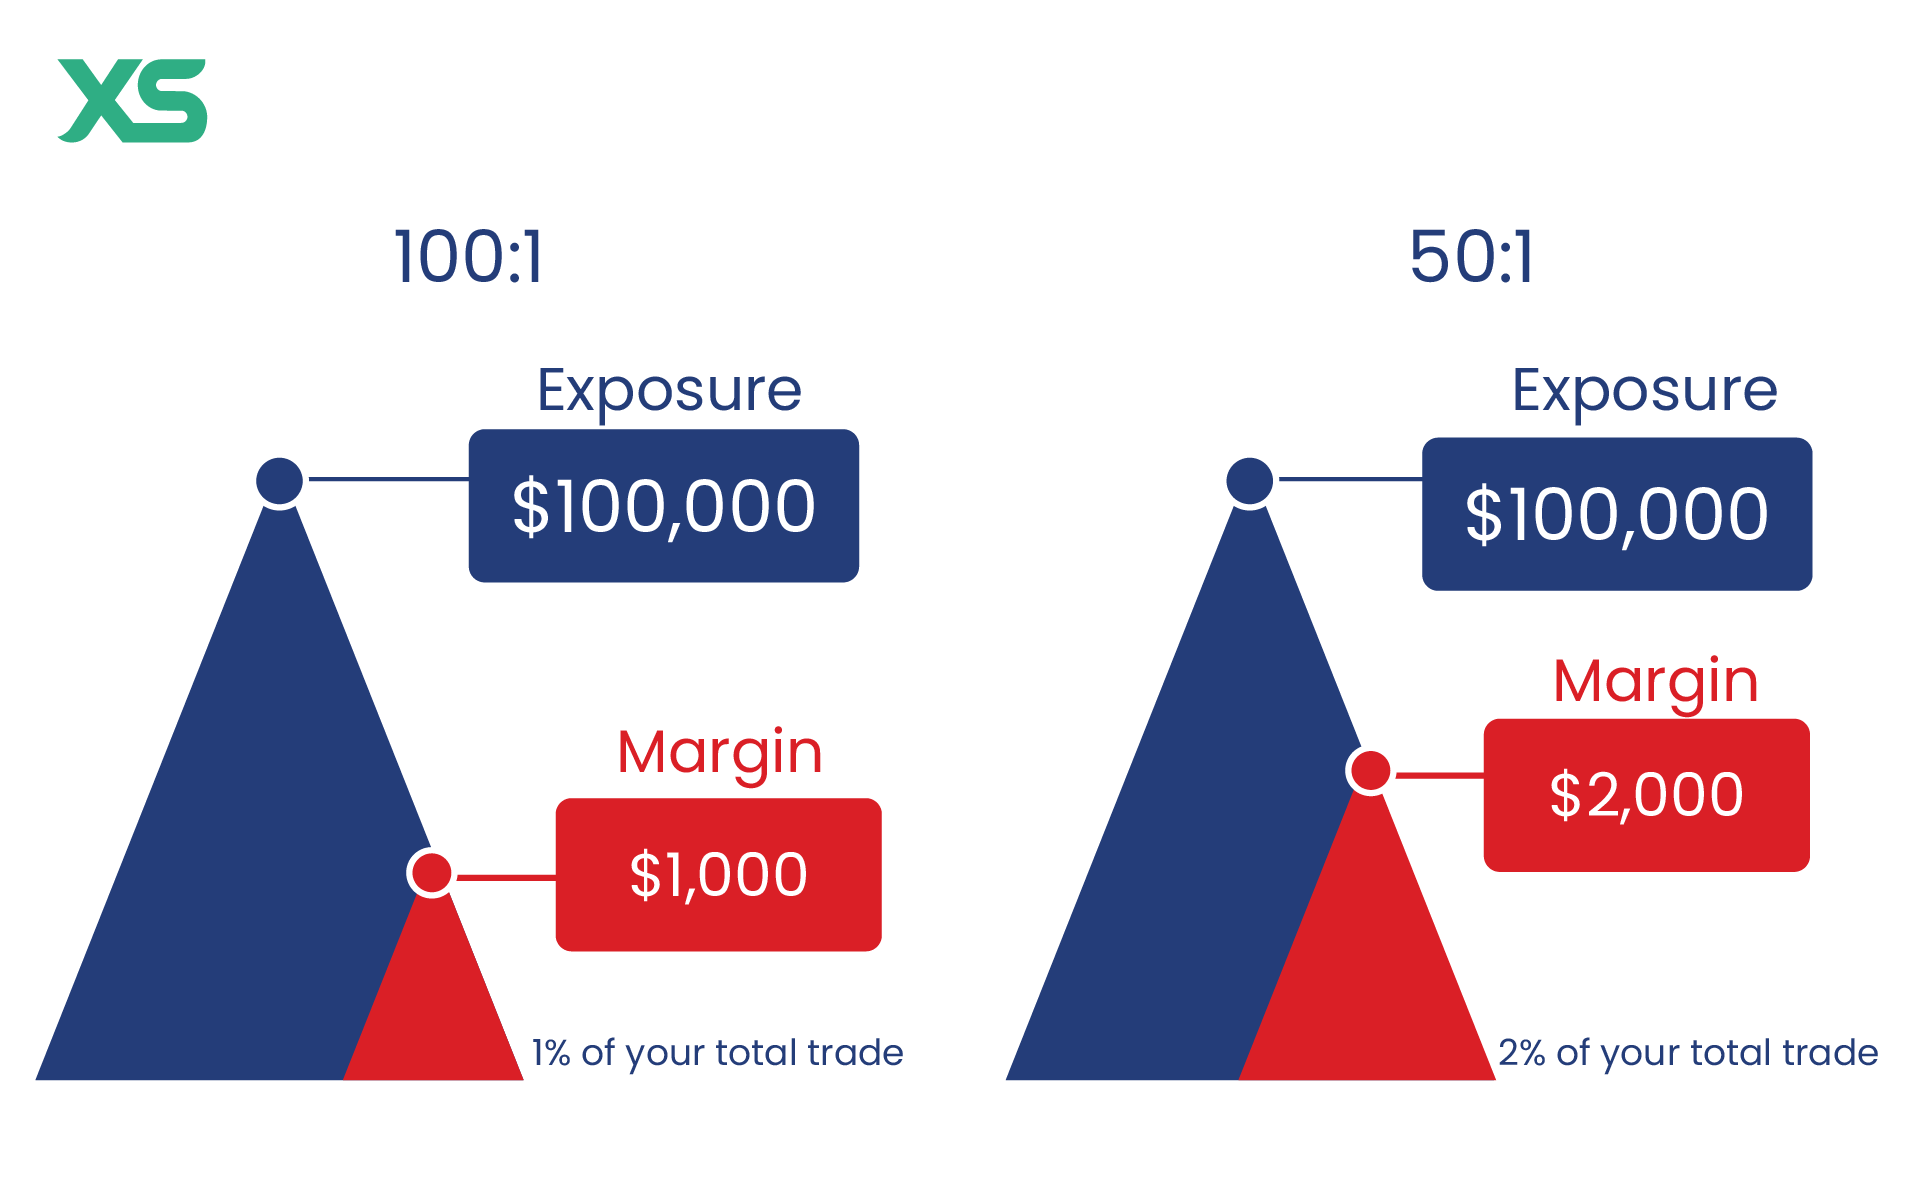
How leverage amplifies both gains and devastating losses in scalping
The Leverage Illusion
High leverage makes scalping appear more profitable by allowing traders to achieve meaningful returns from small price movements. A 5-pip move with 100:1 leverage can generate impressive percentage returns, creating the illusion of a successful strategy. However, this same leverage ensures that even small adverse moves can wipe out accounts with devastating speed.
Leverage Reality Check
With 100:1 leverage, a 1% adverse move destroys the entire account. Most scalpers use even higher leverage, making account destruction not just possible, but statistically inevitable over time.
Psychological Leverage Trap
Leverage creates a psychological addiction similar to gambling. Small wins feel enormous due to leverage amplification, while losses are minimized in the trader’s mind because they represent “just a few pips.” This psychological distortion leads to increasingly reckless position sizing until a inevitable large loss destroys the account.
Winning Trade Psychology
- • “I made 50% in one hour!”
- • Overconfidence in strategy
- • Desire to increase position size
- • Ignoring the role of luck
Losing Trade Psychology
- • “It’s only 10 pips against me”
- • Refusal to accept loss
- • Adding to losing positions
- • Account blown in single session
The Margin Call Inevitability
Mathematics dictates that highly leveraged scalping strategies will eventually encounter market conditions that trigger margin calls. Flash crashes, news events, or simple gaps can instantly move prices beyond a scalper’s risk tolerance, resulting in automatic position liquidation at the worst possible levels. The question isn’t if this will happen, but when.
Common Beginner Mistakes That Guarantee Failure
New scalpers make predictable mistakes that virtually guarantee failure. Understanding these common errors reveals why scalping appears deceptively simple but proves devastatingly difficult in practice.
Overtrading: The Fatal Compulsion
The most destructive mistake beginners make is overtrading—taking excessive numbers of trades in pursuit of quick profits. The constant availability of price movements on short timeframes creates an illusion of continuous opportunities, leading novice scalpers to trade impulsively rather than selectively.
Overtrading Statistics
Beginner scalpers average 50-100+ trades per day compared to 2-5 trades for successful long-term traders. This frequency ensures that transaction costs alone destroy profitability, even with a positive win rate.
Ignoring Risk Management
Beginners often skip risk management because small position sizes seem to limit profit potential. They risk 5-10% per trade, reasoning that “it’s only a few pips.” This approach guarantees eventual account destruction when the inevitable series of losses occurs.
Beginner Approach
- • Risk 5-10% per trade
- • No position sizing rules
- • Wide stop losses “just in case”
- • No maximum daily loss limit
- • Revenge trading after losses
Professional Approach
- • Risk 0.5-1% per trade maximum
- • Consistent position sizing
- • Tight, logical stop losses
- • Daily loss limits enforced
- • Emotional discipline maintained
Chasing Trades and FOMO
Fear of missing out (FOMO) drives beginners to chase price movements that have already occurred. They see a strong move and jump in, typically at the worst possible moment—just as the move exhausts itself. This pattern repeats endlessly, with each chase trade resulting in small losses that accumulate into significant damage.
Misunderstanding Volume and Liquidity
New scalpers often trade during low-liquidity periods when spreads widen and price movements become erratic. They fail to understand that scalping requires high liquidity to function properly, leading them to trade during Asian sessions, lunch hours, or around holidays when professional traders are absent and market conditions are hostile to scalping strategies.
Why Most Scalping Strategies Are Statistically Doomed
The mathematical realities of scalping create insurmountable statistical disadvantages that doom most strategies to failure. Understanding these mathematical truths explains why scalping appears profitable in backtests but fails consistently in live trading.
The Win Rate Fallacy
Scalping strategies often boast high win rates—60%, 70%, even 80%—which attracts traders seeking consistent profits. However, these high win rates are mathematically meaningless when profit targets are smaller than stop losses. A strategy that wins 80% of trades but loses more on each losing trade than it gains on winning trades is guaranteed to lose money over time.
Mathematical Example
Strategy: 80% Win Rate
- • Average win: +5 pips
- • Average loss: -25 pips
- • 100 trades: 80 wins × 5 = +400 pips
- • 20 losses × 25 = -500 pips
- • Net result: -100 pips (loss)
The Randomness Problem
Short-term price movements contain significant random elements that make consistent prediction impossible. While longer timeframes allow fundamental factors to influence price direction, scalping timeframes are dominated by noise, emotion, and algorithmic activity that follows no predictable patterns.
Success Rate
Scalpers profitable after 1 year
Failure Rate
Accounts blown within 12 months
Total Failure
Long-term scalping failure rate
Transaction Cost Mathematics
The mathematics of frequent trading create an insurmountable disadvantage. Even with a 60% win rate and 1:1 risk-reward ratios, transaction costs of just 0.5 pips per trade can turn a profitable strategy into a consistent loser. Most scalpers face transaction costs of 1-3 pips per trade, making profitability mathematically impossible over significant sample sizes.
The Scalping Survivors: What Separates Winners from Losers
While the vast majority of scalpers fail, a small percentage do manage to achieve consistent profitability. Understanding what separates these survivors from the failed masses reveals the extreme requirements for scalping success and why so few traders meet these standards.
Exceptional Psychological Control
Successful scalpers possess extraordinary emotional control that allows them to maintain discipline under extreme pressure. They can execute hundreds of trades per day without being affected by individual wins or losses, maintaining consistent risk management and decision-making processes regardless of recent performance.
Survivor Characteristics
Profitable scalpers typically have backgrounds in high-pressure environments: military service, emergency medicine, or professional gaming. They possess natural psychological traits that 99% of the population lacks.
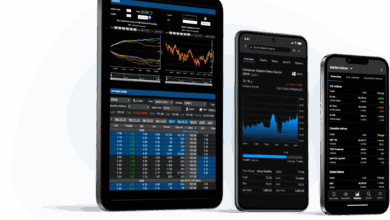
Technology and Infrastructure Advantages
Successful scalpers invest heavily in technology: co-located servers, direct market access, custom trading platforms, and ultra-low latency connections. These technological advantages often cost $50,000-$500,000+ annually, putting them beyond the reach of retail traders attempting to scalp with standard platforms.
Institutional Resources
The few profitable scalpers typically work for proprietary trading firms or hedge funds with access to institutional pricing, advanced risk management systems, and professional support infrastructure. They’re not individual traders working from home—they’re professionals in institutional environments with every possible advantage.
Retail Scalper Reality
- • Standard retail platform
- • Home internet connection
- • Standard spreads and commissions
- • No institutional support
- • Limited capital and technology
Professional Scalper Advantages
- • Co-located servers
- • Direct market access
- • Institutional pricing
- • Professional risk management
- • Unlimited capital backing
Market Timing Mastery
Successful scalpers understand market microstructure intimately. They trade only during optimal liquidity windows, avoid news events and market openings/closings, and can identify the subtle patterns that indicate when conditions favor their strategies. This knowledge comes from years of experience and often significant losses during the learning process.
Conclusion: The Scalping Reality Check
The evidence is overwhelming: scalping strategies fail for mathematical, psychological, and structural reasons that cannot be overcome through better indicators, more discipline, or improved risk management. The combination of transaction costs, market noise, technological disadvantages, and human psychological limitations creates insurmountable obstacles for retail traders.
The Bottom Line
Scalping is not a viable trading strategy for retail traders. The statistical probability of long-term success is so low that it’s more comparable to gambling than investing. Those few who succeed do so despite scalping, not because of it.
Instead of pursuing scalping strategies that are statistically doomed to fail, traders should focus on longer timeframe approaches that offer genuine edge opportunities. Swing trading, position trading, and trend following strategies provide much better risk-adjusted returns without the psychological stress and mathematical disadvantages inherent in scalping.
The allure of quick profits will always attract new traders to scalping, but understanding these fundamental limitations can save countless hours, significant capital, and psychological damage. Success in trading comes from finding strategies that align with market realities, not from fighting against mathematical certainties.