Why Head and Shoulders Pattern Fails?
Unmasking the Hidden Traps: Why the Most Famous Reversal Pattern Deceives Even Expert Traders.
Why Head and Shoulders Pattern Fails?
The Deceptive Head: When Head and Shoulders Pattern Fails
Understanding Common Identification Mistakes and How to Avoid Trading Pitfalls
The Harsh Reality of Pattern Trading
The Head and Shoulders pattern is often hailed as one of the most reliable reversal patterns in technical analysis. However, recent studies reveal that this “reliable” pattern now fails nearly 50% of the time, leaving traders confused and portfolios damaged. The question isn’t whether this pattern works, but rather why it fails so frequently and how traders can adapt to this new reality.
For decades, the Head and Shoulders pattern has been the cornerstone of technical analysis education. From textbooks to trading courses, this pattern is presented as a reliable signal for trend reversals. However, the modern trading landscape has fundamentally changed, and with it, the effectiveness of traditional patterns.
In this comprehensive analysis, we’ll uncover the hidden reasons behind Head and Shoulders pattern failures, examine the common mistakes traders make in identification, and provide practical strategies for navigating these deceptive setups. Understanding why patterns fail is often more valuable than understanding why they succeed.
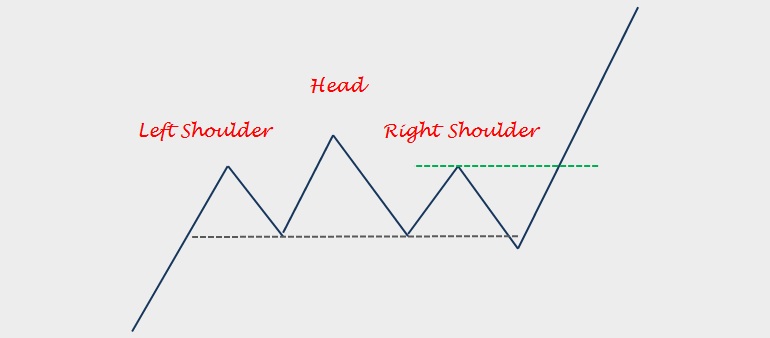
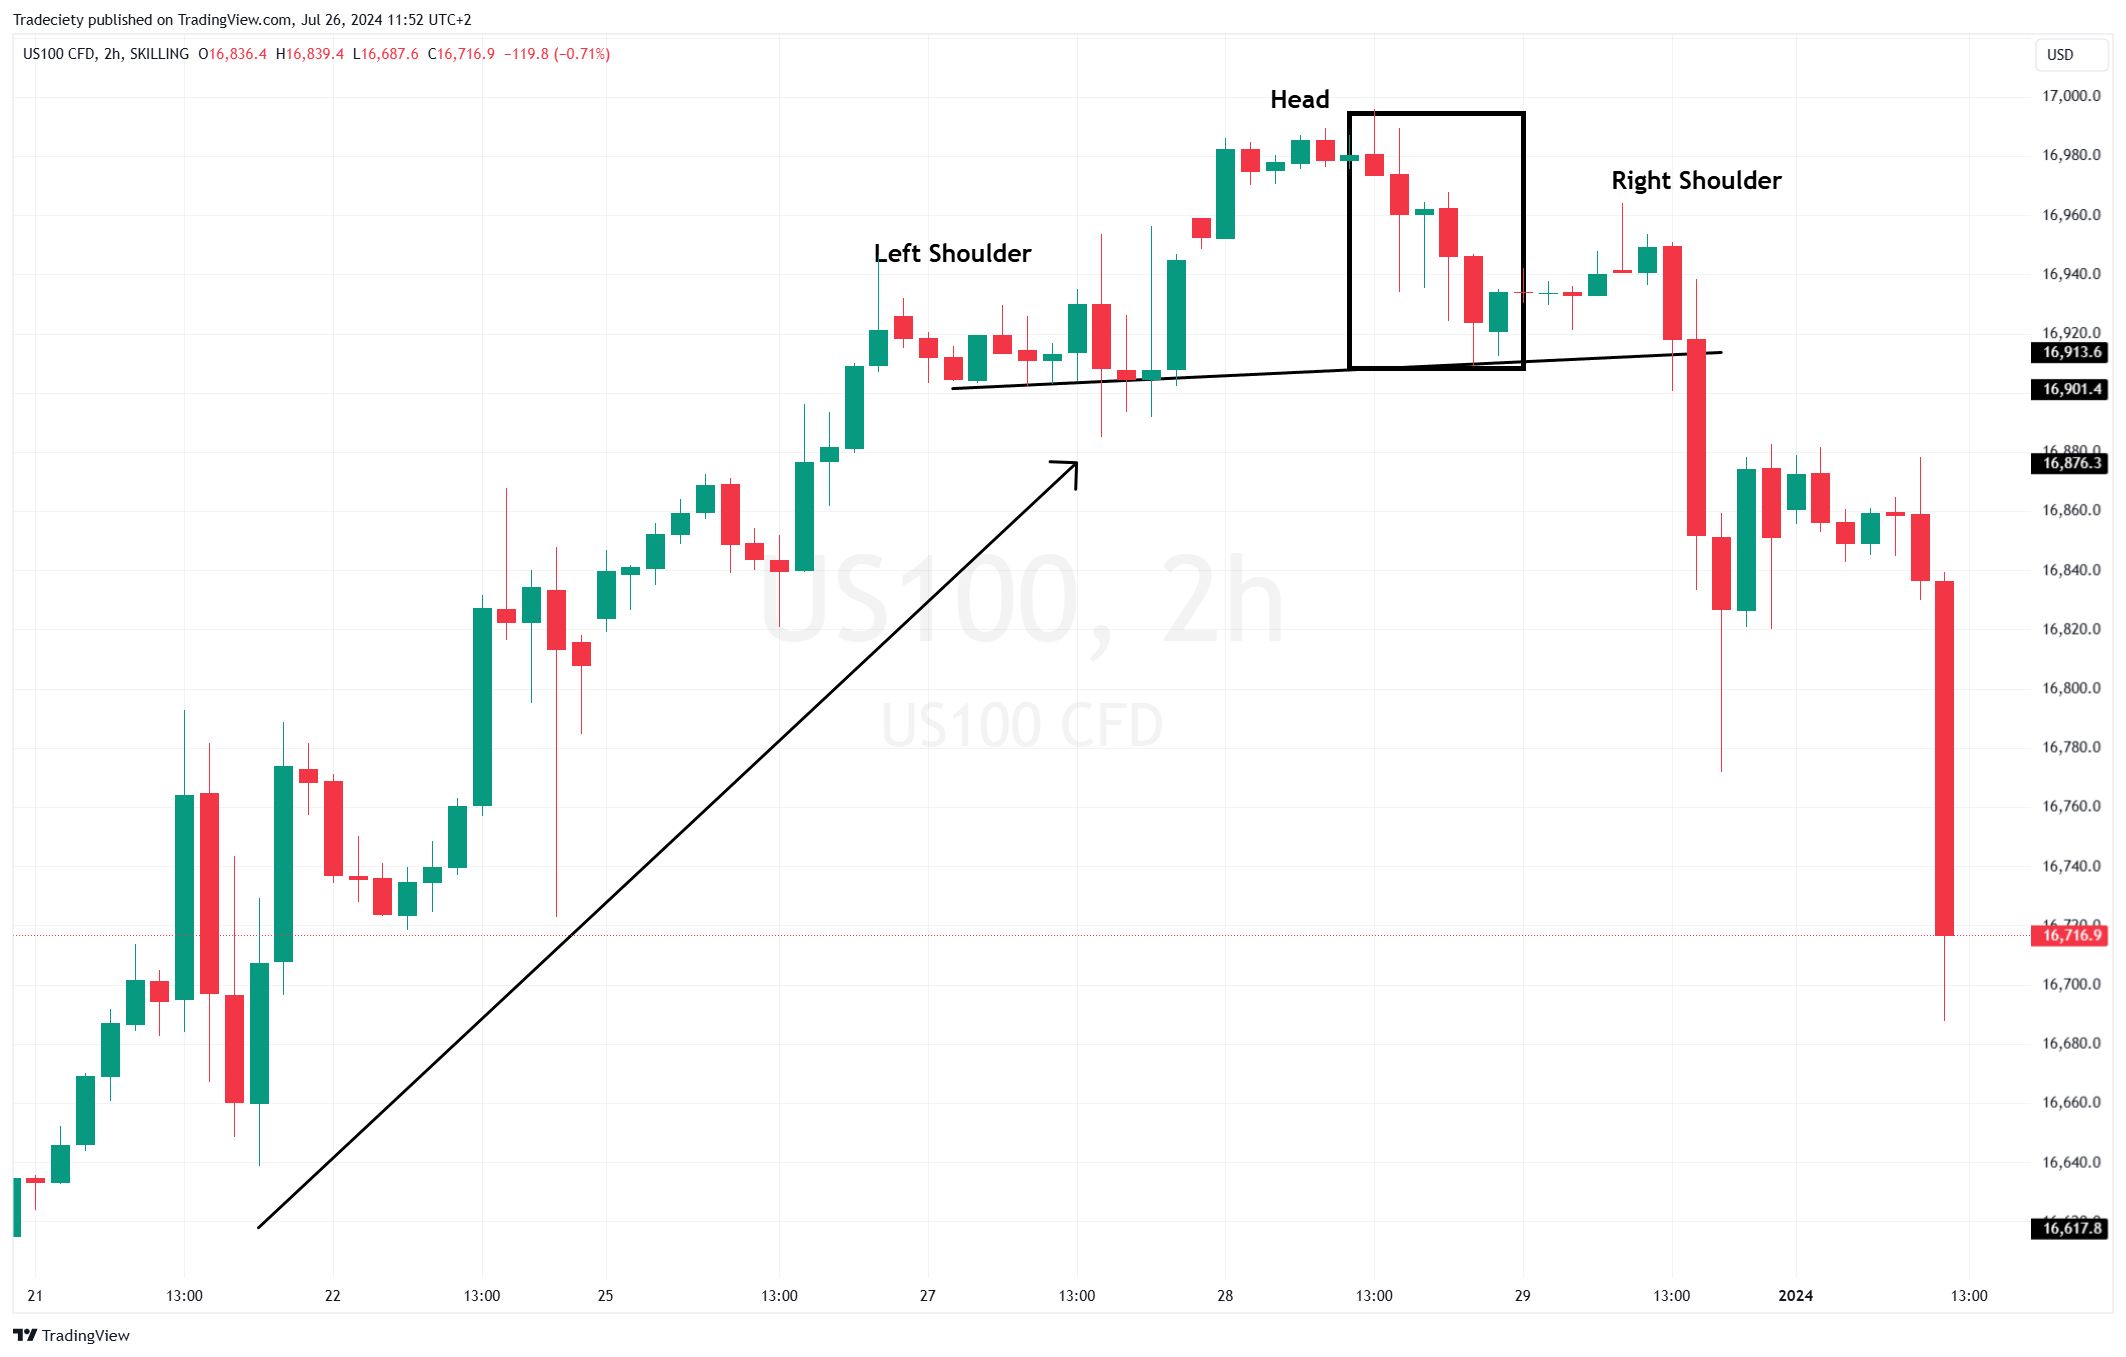
Understanding the Head and Shoulders Pattern
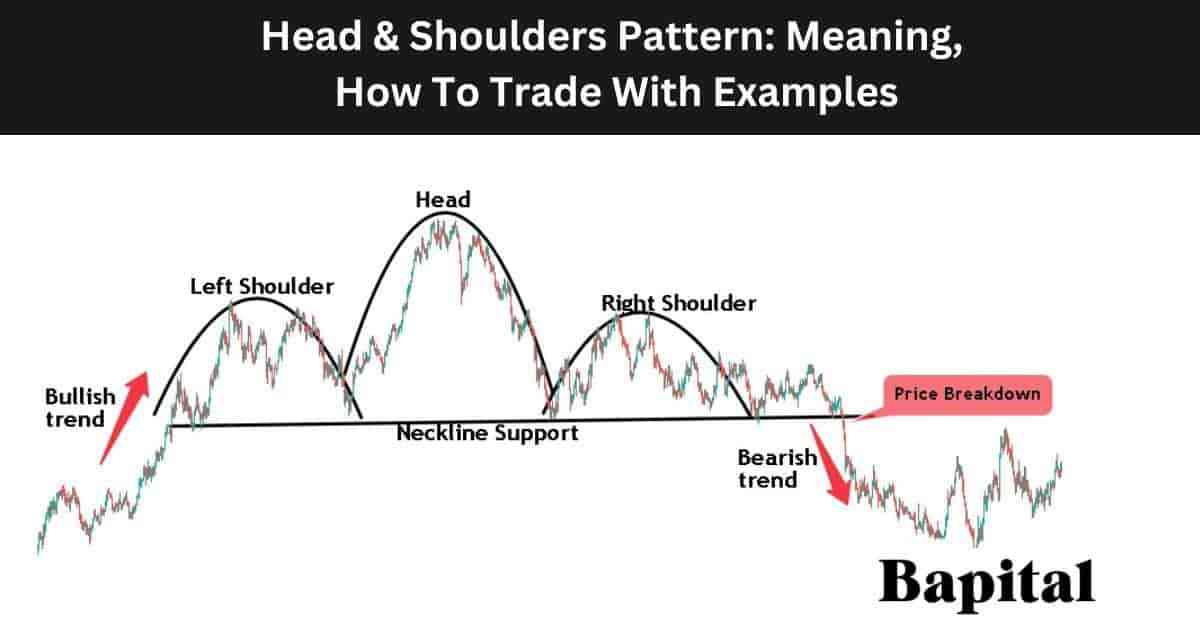
Classic Head and Shoulders pattern structure with three peaks
Before diving into failure analysis, it’s crucial to understand what constitutes a proper Head and Shoulders pattern. This reversal pattern consists of three peaks: a central peak (the head) flanked by two smaller peaks (the shoulders). The pattern is completed when price breaks below the neckline connecting the lows between the peaks.
Traditional Pattern Components
- Left Shoulder: Initial peak followed by a decline
- Head: Higher peak that exceeds the left shoulder
- Right Shoulder: Peak similar in height to left shoulder
- Neckline: Support line connecting the lows
- Volume: Should decrease from left to right
The theoretical foundation suggests that as the pattern develops, buying pressure weakens with each successive peak, evidenced by declining volume. The break below the neckline supposedly confirms the reversal, with a price target equal to the distance from the head to the neckline projected downward from the breakout point.
The Shocking Reality: Failure Rates Revealed
Modern Failure Rate
Up from 25% in the 1990s
Crypto Market Failures
Higher volatility increases failure rate
Traditional Markets
Stocks and forex patterns
Critical Finding: Pattern Reliability Declining
Research by LuxAlgo and other technical analysis firms shows that Head and Shoulders pattern failure rates have nearly doubled since the 1990s. In today’s algorithmic trading environment, traditional patterns are increasingly exploited and invalidated, making them less reliable for retail traders.
Real-world example of Head and Shoulders pattern failure
The dramatic increase in failure rates isn’t coincidental. Several factors contribute to this phenomenon, including increased market sophistication, algorithmic trading, and the proliferation of technical analysis knowledge among retail traders. When everyone knows the same patterns, they become less effective.
Moreover, the timeframe analysis reveals that shorter timeframes (1-hour to daily) show higher failure rates compared to weekly and monthly charts. This suggests that the pattern may still hold some validity for longer-term analysis, but its effectiveness in day trading and swing trading has significantly diminished.
Common Identification Mistakes That Lead to Failure
Components of a failed Head and Shoulders pattern
1. The Proportion Problem
One of the most critical mistakes traders make is accepting patterns with improper proportions. A genuine Head and Shoulders pattern requires the head to be significantly higher than both shoulders, with shoulders being roughly equal in height. Many traders identify patterns where the differences are minimal, leading to false breakouts.
Proper Proportion Guidelines
- Head should be at least 15-20% higher than shoulders
- Shoulders should be within 5-10% of each other in height
- Time symmetry: Each phase should take similar time to develop
- Volume should show clear declining pattern
2. Volume Misinterpretation
Volume analysis is perhaps the most overlooked aspect of Head and Shoulders pattern validation. Authentic patterns show declining volume from the left shoulder to the right shoulder, indicating weakening buying pressure. However, many traders ignore volume or misinterpret volume spikes during the right shoulder formation.
3. Premature Pattern Recognition
The eagerness to identify patterns often leads traders to call a Head and Shoulders formation before it’s complete. This premature recognition results in entering positions based on incomplete patterns, which frequently fail to develop as expected. A pattern is only valid after the neckline break with confirmation.
Timing Trap: The Incomplete Pattern
Studies show that 60% of pattern failures occur because traders act on incomplete formations. The pattern must be fully developed with a confirmed neckline break before any trading decisions are made. Patience in pattern recognition is crucial for success.
4. Context Ignorance
Perhaps the most significant mistake is ignoring the broader market context. Head and Shoulders patterns appearing in strong trending markets or during high-impact news events have dramatically higher failure rates. The pattern works best in mature uptrends that are naturally exhausting, not in markets with strong fundamental drivers pushing prices higher.
Psychological Factors Behind Pattern Failures
The modern trading environment has fundamentally altered the psychological dynamics that originally made Head and Shoulders patterns effective. Understanding these changes is crucial for adapting trading strategies to current market conditions.
The Crowded Trade Phenomenon
When technical analysis became mainstream, patterns like Head and Shoulders became widely recognized. This widespread knowledge creates a self-defeating prophecy: as more traders identify and act on the same patterns, market makers and algorithmic systems exploit this predictability. The result is false breakouts designed to trap retail traders.
Example of Head and Shoulders top failure in action
Algorithmic Trading Impact
High-frequency trading algorithms are programmed to recognize classic patterns and either fade them or create false breakouts. These systems can identify forming patterns faster than human traders and position themselves to profit from pattern failures. This technological advantage has shifted the odds against traditional pattern traders.
The Algorithm Advantage
Modern algorithms can process pattern recognition in milliseconds and execute trades before retail traders even identify the setup. They’re programmed to exploit the predictable behavior of pattern traders, creating false breakouts that trap manual traders in losing positions.
Confirmation Bias and Pattern Forcing
Traders often see patterns where none exist, forcing price action into familiar formations. This confirmation bias leads to trading sub-optimal setups that have higher failure rates. The desire to find tradeable patterns can override objective analysis, resulting in poor trading decisions.
Trading Strategies for Failed Patterns
Rather than avoiding Head and Shoulders patterns entirely, sophisticated traders have developed strategies to profit from pattern failures. These contrarian approaches can be highly profitable when executed correctly.

Bitcoin’s Head and Shoulders pattern invalidation leading to significant upside movement
The Failure Reversal Strategy
When a Head and Shoulders pattern fails (price moves back above the right shoulder), it often signals a strong continuation of the original trend. This failure can be traded as a powerful bullish signal, with targets often exceeding the original head level. The key is waiting for confirmation that the pattern has definitively failed.
Failure Trading Setup
- Entry: Price closes above right shoulder high
- Stop Loss: Below the neckline or recent low
- Target 1: Distance from neckline to head, projected upward
- Target 2: Previous resistance levels or measured moves
- Volume: Look for increased volume on the failure breakout
Risk Management in Pattern Trading
Given the high failure rates, risk management becomes paramount when trading Head and Shoulders patterns. Position sizing should be reduced, and stop losses should be tighter than traditional recommendations. Never risk more than 1-2% of capital on a single pattern trade.
Critical Risk Management Rules
With failure rates approaching 50%, traditional risk management must be adapted. Use smaller position sizes, wider stops to account for false breakouts, and always have a plan for when the pattern fails. Consider the failure scenario as likely as the success scenario.
Multiple Timeframe Confirmation
One method to improve pattern reliability is using multiple timeframe analysis. A Head and Shoulders pattern on a daily chart should be confirmed by the weekly chart structure. Patterns that appear in isolation on single timeframes have higher failure rates than those confirmed across multiple timeframes.
Alternative Approaches and Modern Solutions
As traditional pattern recognition becomes less reliable, traders are adopting new approaches that combine classical techniques with modern market understanding. These hybrid strategies acknowledge the changed landscape while still utilizing the psychological insights that patterns provide.
Sentiment-Based Pattern Analysis
Modern traders are incorporating sentiment analysis with pattern recognition. Social media sentiment, options flow, and institutional positioning can provide additional context for whether a Head and Shoulders pattern is likely to succeed or fail. Patterns that align with broader sentiment have higher success rates.
Quantitative Pattern Validation
Instead of relying purely on visual pattern recognition, quantitative approaches measure specific characteristics like symmetry, volume profiles, and volatility patterns. These measurable criteria can help filter out low-probability setups and improve overall success rates.
Quantitative Validation Criteria
Modern pattern analysis incorporates measurable criteria: volume decline ratios, price symmetry calculations, momentum divergences, and market structure analysis. These quantitative filters help identify higher-probability patterns and avoid subjective interpretation errors.
Integration with Market Structure
Rather than trading patterns in isolation, successful modern traders integrate them with market structure analysis. Head and Shoulders patterns that form at significant support/resistance levels, near key Fibonacci retracements, or at important volume levels have higher success rates than isolated patterns.
The Evolution of Pattern Trading
The future of pattern trading lies not in abandoning classical analysis but in evolving it. Successful traders are combining traditional patterns with modern tools: order flow analysis, institutional positioning, algorithmic trading signals, and real-time sentiment data. This hybrid approach acknowledges both the enduring psychological aspects of markets and the changed technological landscape.
Real-World Case Studies: When Patterns Deceive
Learning from actual market examples provides invaluable insights into why patterns fail and how to recognize potential failures before they occur. These case studies illustrate the importance of context, confirmation, and adaptive strategies.
Case Study 1: The Bitcoin Deception (2024)
In early 2024, Bitcoin formed what appeared to be a textbook Head and Shoulders pattern around the $45,000 level. The pattern had all the visual elements: clear left shoulder at $42,000, head at $48,000, and right shoulder at $43,000. The neckline was drawn at $38,000, suggesting a target of $28,000.
However, the pattern failed spectacularly. Instead of breaking down, Bitcoin reversed sharply from the neckline and eventually broke above $50,000. Traders who shorted the neckline break faced significant losses. The failure occurred because the analysis ignored the broader context: institutional adoption, ETF approvals, and strong on-chain metrics.
Key Lesson: Context Trumps Patterns
This case demonstrates that even perfect-looking patterns can fail when fundamental factors overwhelm technical signals. The lesson: never trade patterns in isolation from broader market context and fundamental developments.
Case Study 2: The NASDAQ False Breakdown (2023)
During the 2023 tech selloff, the NASDAQ 100 formed a Head and Shoulders pattern that briefly broke below its neckline, triggering widespread selling from pattern traders. However, the breakdown was quickly reversed within 48 hours, leading to a strong rally that caught short sellers off guard.
The failure occurred due to algorithmic buying programs that kicked in at key support levels, combined with oversold conditions and positive earnings surprises from major tech companies. The initial breakdown was a “stop hunt” that cleared out weak hands before the real move higher.
Case Study 3: The Gold Pattern Trap (2022)
Gold formed a Head and Shoulders pattern during the 2022 inflation period, with many traders expecting a significant breakdown. However, the pattern failed as geopolitical tensions and persistent inflation fears drove renewed buying. The failure highlighted how macroeconomic factors can override technical patterns, especially in safe-haven assets during uncertain times.
Advanced Methods for Detecting Pattern Failures
Experienced traders have developed sophisticated methods for identifying potential pattern failures before they occur. These techniques go beyond basic pattern recognition and incorporate market microstructure, sentiment analysis, and institutional behavior.
Volume Profile Analysis
Traditional volume analysis looks at total volume, but volume profile analysis examines where volume occurred at different price levels. A Head and Shoulders pattern with high volume nodes near the neckline often fails because these represent areas of strong support where institutions have accumulated positions.
Volume Profile Warning Signs
- High volume nodes at or near the neckline level
- Point of Control (POC) coinciding with pattern support
- Value Area Low aligning with neckline
- Unusual institutional activity near key levels
- Absorption patterns during neckline tests
Options Flow and Sentiment Indicators
Options activity often provides early warning signs of pattern failures. Large put/call ratios, unusual options activity, and gamma positioning can indicate institutional sentiment that contradicts the pattern’s implications. When smart money positions opposite to the pattern’s suggestion, failure becomes more likely.
Market Internals and Breadth Analysis
Market breadth indicators often diverge from price patterns before failures occur. For example, if a Head and Shoulders pattern forms in an index while advance-decline lines remain strong, the pattern is more likely to fail. These internal measures provide insight into the underlying market health that price patterns might not reveal.
Breadth Divergence Signals
When price forms bearish patterns but breadth indicators (advance-decline line, new highs-lows, sector rotation) remain healthy, pattern failure becomes more likely. These divergences often precede significant trend continuations that invalidate reversal patterns.
Intermarket Analysis
Related markets often provide confirmation or contradiction of pattern signals. Currency movements, commodity prices, bond yields, and sector rotations can all influence whether a pattern succeeds or fails. A comprehensive analysis considers these intermarket relationships before making trading decisions.
The Future of Pattern Trading in Modern Markets
As markets continue to evolve with technology, artificial intelligence, and changing participant behavior, pattern trading must adapt or become obsolete. The future belongs to traders who can blend classical analysis with modern tools and understanding.
AI-Enhanced Pattern Recognition
Artificial intelligence is revolutionizing pattern recognition by identifying subtle variations and market conditions that affect pattern success rates. Machine learning algorithms can process thousands of historical patterns to identify which characteristics lead to success or failure, providing traders with probability-based pattern analysis.
Adaptive Pattern Strategies
The most successful future traders will use adaptive strategies that adjust based on current market conditions. These strategies incorporate volatility regimes, market sentiment, institutional positioning, and macroeconomic factors to determine when patterns are likely to work and when they’re likely to fail.
The Evolution Imperative
Traders who continue using pattern recognition exactly as it was taught decades ago will increasingly struggle. The market has evolved, and successful pattern trading requires evolution too. This means incorporating new tools, understanding new market dynamics, and accepting that traditional patterns work differently in modern markets.
Integration with Quantitative Methods
The future of pattern trading lies in quantitative validation. Instead of subjective pattern identification, successful traders use measurable criteria, statistical backtesting, and probability-based decision making. This scientific approach helps separate genuine patterns from random price formations and improves overall trading performance.
Conclusion: Mastering Pattern Failures for Trading Success
Key Takeaways for Pattern Traders
- Accept the Reality: Head and Shoulders patterns fail nearly 50% of the time in modern markets
- Context is King: Never trade patterns without considering broader market conditions
- Profit from Failures: Failed patterns often provide better trading opportunities than successful ones
- Adapt Risk Management: Higher failure rates require more conservative position sizing
- Embrace Evolution: Combine classical patterns with modern analytical tools
The Head and Shoulders pattern hasn’t become useless—it has evolved. Understanding why patterns fail is more valuable than memorizing textbook definitions. In today’s markets, the ability to recognize pattern failures, trade them effectively, and adapt to changing conditions separates successful traders from those who struggle with outdated methods.
The most successful pattern traders of the future will be those who understand that patterns are just one piece of a larger analytical puzzle. They combine technical analysis with sentiment analysis, quantitative methods, and real-time market dynamics to make informed decisions. They’re prepared for both pattern success and failure, often profiting more from the failures than the successes.
Remember, the goal isn’t to predict the market perfectly—it’s to be prepared for multiple scenarios and profit from whichever one unfolds. Head and Shoulders patterns, whether they succeed or fail, provide valuable information about market sentiment and potential future movements. The key is knowing how to interpret and act on this information in the context of modern market realities.
Your Next Steps as a Pattern Trader
Start implementing these concepts gradually. Begin by analyzing your past pattern trades to identify which ones failed and why. Incorporate volume profile analysis, sentiment indicators, and broader market context into your pattern recognition process. Most importantly, develop strategies for trading pattern failures—they often provide the most profitable opportunities.
The markets will continue to evolve, and successful traders evolve with them. By understanding why Head and Shoulders patterns fail and how to profit from these failures, you’re positioning yourself ahead of traders who remain stuck in outdated methodologies.
Why Head and Shoulders Pattern Fails?
The Deceptive Head: When Head and Shoulders Pattern Fails
Uncover the hidden reasons behind one of the most famous chart pattern failures and learn how to avoid costly trading mistakes
Critical Trading Reality
Recent studies reveal that the Head and Shoulders pattern fails to reach its target in approximately 35-40% of cases, with failure rates increasing significantly in volatile market conditions. Understanding why this happens could save your trading capital.
The Shocking Truth About Pattern Reliability
The Head and Shoulders pattern has long been considered the “holy grail” of reversal patterns in technical analysis. Traders worldwide have built entire strategies around this seemingly reliable formation, expecting consistent profits from what appears to be a straightforward pattern recognition game. However, the harsh reality of financial markets tells a different story—one filled with false signals, psychological traps, and systematic failures that can devastate trading accounts.
Real-world example of Head and Shoulders pattern failure showing price continuation instead of reversal
What makes this pattern particularly dangerous is its deceptive nature. Unlike other chart formations that might show ambiguous signals, the Head and Shoulders pattern often appears crystal clear to the naked eye, creating a false sense of confidence among traders. This psychological aspect becomes one of the primary reasons for its failure, as market participants pile into positions based on textbook interpretations without considering the underlying market dynamics that could invalidate the pattern.
Pattern Failure Rate
Cases that don’t reach target
False Breakout Rate
In volatile conditions
Misidentification Rate
Among retail traders
The Anatomy of Deception: How Perfect Patterns Fool Traders
The most dangerous Head and Shoulders patterns are often the ones that look “too perfect.” These formations appear with textbook precision—three distinct peaks with the middle one clearly higher than the shoulders, a well-defined neckline, and what seems like obvious volume confirmation. However, this perfection is frequently the market’s way of setting a trap for unwary traders.
The Perfection Trap
Patterns that appear “too obvious” often fail because they attract too much attention from retail traders, making them prime targets for institutional manipulation. Professional traders and market makers are well aware of these popular formations and often use them as liquidity zones to execute large orders in the opposite direction.
The deception begins with the formation process itself. As the right shoulder develops, retail traders start positioning for the anticipated breakdown below the neckline. This creates a concentration of stop-loss orders just below the support level, which sophisticated market participants can exploit. When the pattern appears to complete with a neckline break, these stops are triggered, creating temporary downward pressure that reinforces the pattern’s validity.
Classic example of Head and Shoulders top failure where the pattern breaks down initially but then reverses strongly upward
However, this is where the trap springs shut. Large institutional players, having accumulated positions during the formation phase, begin their buying programs once the weak hands have been shaken out. The result is a violent reversal that catches pattern traders off-guard, often leading to significant losses as positions are stopped out at the worst possible levels.
The Five Critical Identification Mistakes
1. Ignoring Time Frame Context
One of the most common mistakes traders make is identifying Head and Shoulders patterns on inappropriate time frames. Many traders spot these formations on short-term charts (5-minute, 15-minute) without considering the broader market context. A Head and Shoulders pattern on a 15-minute chart might seem compelling, but if the daily or weekly trend is strongly bullish, the pattern’s reliability diminishes significantly.
Time Frame Hierarchy Rule:
Always confirm shorter time frame patterns with longer time frame trends. A 4-hour Head and Shoulders pattern carries more weight when aligned with daily and weekly trend analysis than when it contradicts the higher time frame direction.
2. Volume Analysis Negligence
Volume is the lifeblood of any chart pattern, yet it’s often the most overlooked aspect of Head and Shoulders analysis. Traders focus intensely on the price formation while ignoring the volume characteristics that could validate or invalidate the pattern. Authentic Head and Shoulders reversals should show decreasing volume as the pattern develops, with the right shoulder typically showing the lowest volume of the three peaks.
Detailed breakdown of Head and Shoulders pattern components showing where failures typically occur
The most reliable volume pattern for a bearish Head and Shoulders formation shows:
- High volume on the left shoulder formation
- Peak volume at the head formation
- Noticeably lower volume on the right shoulder
- Increasing volume on the neckline break
When volume doesn’t follow this pattern—particularly when the right shoulder shows high volume or when the neckline break occurs on low volume—the probability of pattern failure increases dramatically.
3. Neckline Construction Errors
The neckline is arguably the most crucial component of the Head and Shoulders pattern, yet many traders construct it incorrectly. The proper neckline should connect the lows between the left shoulder and head, and between the head and right shoulder. However, traders often force necklines to fit their bias, drawing lines that connect points that shouldn’t be connected or ignoring obvious connection points that don’t support their thesis.
Common Neckline Mistakes:
- Drawing necklines that require significant slope adjustments
- Ignoring obvious support/resistance levels when constructing the neckline
- Using different time frames for neckline construction and pattern identification
- Forcing horizontal necklines when the market structure suggests otherwise
4. Proportion and Symmetry Oversights
Authentic Head and Shoulders patterns exhibit certain proportional relationships that many traders overlook. The shoulders should be roughly similar in height and width, though perfect symmetry isn’t required. More importantly, the head should extend significantly above both shoulders—typically by at least 3-5% in liquid markets.
Patterns where the head barely exceeds the shoulders, or where one shoulder is dramatically different from the other, have much higher failure rates. These formations often represent consolidation patterns rather than reversal patterns, making them poor candidates for traditional Head and Shoulders trading strategies.
5. Market Context Ignorance
Perhaps the most critical mistake is trading Head and Shoulders patterns without considering the broader market context. A bearish Head and Shoulders pattern forming near strong support levels, during oversold conditions, or in the context of a strong bull market has a significantly higher failure rate than one forming at resistance after an extended rally.
Context Checklist
- Overall market trend direction and strength
- Proximity to major support/resistance levels
- Market sentiment and positioning data
- Economic calendar and fundamental factors
- Seasonal patterns and historical tendencies
The Psychology of Pattern Failure
Understanding the psychological dynamics behind Head and Shoulders pattern failures is crucial for any serious trader. These patterns don’t fail randomly—they fail for specific psychological and behavioral reasons that, once understood, can actually be exploited for profitable trading opportunities.
Bitcoin’s Head and Shoulders pattern invalidation showing how strong trends can overpower even well-formed patterns
The Crowd Psychology Factor
Head and Shoulders patterns are among the most widely recognized chart formations, making them susceptible to crowd psychology effects. When a pattern becomes too obvious, it attracts attention from retail traders who lack the capital and sophistication to move markets significantly. This creates an imbalance where everyone is positioned for the same outcome, making the opposite outcome more likely.
Professional traders and institutional players are acutely aware of this dynamic. They often use popular chart patterns as contra-indicators, positioning themselves opposite to the retail crowd. This is particularly effective with Head and Shoulders patterns because they provide clear entry and exit points that can be easily identified and exploited.
The Confirmation Bias Trap
Once traders identify a potential Head and Shoulders pattern, confirmation bias often takes over. They begin interpreting all subsequent price action through the lens of pattern completion, ignoring signals that might suggest the pattern is failing. This selective attention can be financially devastating, as traders hold onto losing positions far longer than they should, convinced that the pattern will eventually play out as expected.
Breaking the Bias Cycle:
Set specific invalidation levels before entering any pattern-based trade. If price action violates these levels, exit immediately regardless of how perfect the pattern appears. The market is always right, and patterns are just tools—not guarantees.
Volume Analysis: The Silent Killer of Patterns
Volume analysis represents one of the most sophisticated aspects of Head and Shoulders pattern evaluation, yet it’s also where most traders make critical errors. Understanding volume patterns can often predict pattern failure before it becomes obvious in price action, providing savvy traders with a significant edge.
The Volume Divergence Warning
One of the most reliable early warning signs of Head and Shoulders pattern failure is volume divergence during the right shoulder formation. When the right shoulder forms on higher volume than expected, it often indicates that the selling pressure is not as strong as the pattern suggests. This divergence frequently precedes pattern failure and trend continuation.
Conversely, when volume contracts too much during the right shoulder formation, it can indicate a lack of genuine selling interest, making the pattern vulnerable to upside breakouts. The ideal volume pattern shows gradual decline from left shoulder to right shoulder, with noticeable but not extreme volume expansion on the neckline break.
Institutional Volume Signatures
Sophisticated traders look for specific volume signatures that indicate institutional involvement. Large volume spikes during seemingly minor price moves often signal that big players are positioning contrary to the obvious pattern interpretation. These volume anomalies can be early indicators of impending pattern failure.
Red Flag Volume Patterns:
- Unusually high volume on minor bounces within the pattern
- Volume spikes that don’t correspond to significant price moves
- Decreasing volume on what should be key breakout moves
- Volume patterns that contradict the price narrative
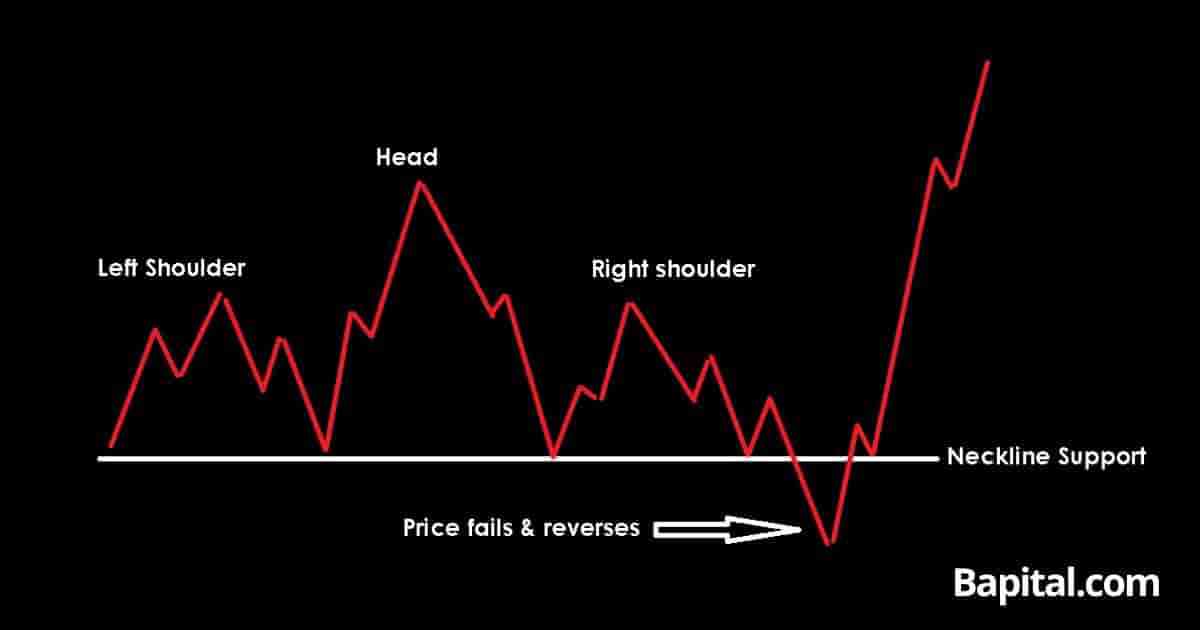
False Breakouts: The Market’s Favorite Weapon
False breakouts represent perhaps the most painful aspect of Head and Shoulders pattern failures. These occur when price appears to complete the pattern by breaking below the neckline, only to reverse sharply higher, catching pattern traders in devastating losses. Understanding how and why false breakouts occur is essential for avoiding these traps.
:max_bytes(150000):strip_icc()/dotdash_Final_How_to_Trade_the_Head_and_Shoulders_Pattern_Jul_2020-01-d955fe7807714feea05f04d7f322dfaf.jpg)
Professional trading guide showing proper Head and Shoulders pattern identification and common failure points
The Stop Hunt Phenomenon
False breakouts often begin as stop hunts—deliberate moves designed to trigger protective stops placed just below obvious support levels. Market makers and large institutional players can see where retail stops are clustered through order flow data, making these levels attractive targets for manipulation.
The typical false breakout scenario unfolds as follows: Price breaks the neckline on moderate volume, triggering retail stops and short entries. This creates temporary selling pressure that drives price further below the neckline, validating the pattern for those watching. However, once the stops are cleared and short positions are established, buying programs begin, often orchestrated by the same institutions that initiated the false break.
Identifying Genuine vs. False Breakouts
Distinguishing between genuine pattern completion and false breakouts requires attention to several key factors:
Genuine Breakout Characteristics:
- Strong volume expansion on the initial break
- Follow-through selling in subsequent sessions
- Inability to reclaim the neckline quickly
- Broad market confirmation of the directional move
- Fundamental catalysts supporting the technical break
False Breakout Warning Signs:
- Low volume on the initial break
- Quick reversal back above the neckline
- Lack of follow-through selling
- Strong support levels nearby
- Oversold conditions on technical indicators
Trading Strategies for Pattern Failures
Ironically, Head and Shoulders pattern failures can provide some of the most profitable trading opportunities available to those who know how to identify and exploit them. Failed patterns often lead to strong trending moves in the opposite direction, as trapped traders are forced to cover positions and momentum players jump aboard the new trend.
The Failure Breakout Strategy
This strategy involves identifying potential Head and Shoulders patterns that show signs of failure, then positioning for the opposite move. The key is timing the entry to catch the pattern invalidation while minimizing risk exposure.
Failure Breakout Entry Rules:
- Identify a well-formed Head and Shoulders pattern
- Wait for neckline break on low volume
- Look for quick reversal back above neckline
- Enter long on break above right shoulder high
- Set stop below the failed breakdown low
- Target previous head high as minimum objective
The Anticipation Strategy
More aggressive traders can attempt to anticipate pattern failures by identifying formations that show early warning signs of weakness. This approach requires considerable skill and experience but can yield exceptional risk-to-reward ratios when executed correctly.
Key indicators for anticipating pattern failure include:
- Volume divergence during right shoulder formation
- Higher lows within the pattern structure
- Strong support levels near the neckline
- Oversold conditions on momentum indicators
- Positive divergence on oscillators
Advanced Pattern Invalidation Techniques
Professional traders use sophisticated techniques to identify pattern invalidation before it becomes obvious to the broader market. These methods combine traditional technical analysis with modern market structure understanding and behavioral finance principles.
:max_bytes(150000):strip_icc()/dotdash_Final_Head_And_Shoulders_Pattern_Sep_2020-01-4c225a762427464699e42461088c1e86.jpg)
Comprehensive Head and Shoulders pattern analysis showing various formation types and validation criteria
Market Structure Analysis
Modern market structure analysis goes beyond simple chart patterns to examine order flow, liquidity patterns, and institutional positioning. Head and Shoulders patterns that form in areas of poor liquidity or during periods of institutional repositioning have much higher failure rates than those forming in liquid markets with clear directional bias.
Multi-Timeframe Confirmation
The most reliable pattern analysis involves confirming shorter-term formations with longer-term trends and structures. A Head and Shoulders pattern on a 4-hour chart carries much more weight when it aligns with daily and weekly resistance levels than when it contradicts higher timeframe support.
Multi-Timeframe Checklist:
- Weekly trend direction and strength
- Daily support/resistance alignment
- 4-hour pattern formation quality
- 1-hour volume confirmation
- 15-minute entry timing precision
Risk Management for Pattern Trading
Given the high failure rate of Head and Shoulders patterns, proper risk management becomes absolutely critical. Many traders focus so intently on pattern identification that they neglect the risk management principles that could protect them from catastrophic losses when patterns fail.
Position Sizing for Pattern Trades
Pattern-based trades should generally be sized smaller than trend-following trades due to their inherently higher failure rates. A good rule of thumb is to risk no more than 1-1.5% of trading capital on any single pattern trade, regardless of how compelling the setup appears.
Stop Loss Placement Strategies
Traditional stop placement for Head and Shoulders patterns involves setting stops above the right shoulder high for short trades. However, this approach often results in stops being placed in obvious locations where they can be easily triggered by routine market volatility or deliberate stop hunting.
Advanced Stop Placement Techniques:
- Use volatility-based stops rather than fixed levels
- Place stops beyond significant psychological levels
- Consider using trailing stops once patterns begin working
- Implement time-based stops for patterns that stall
Alternative Approaches and Modern Solutions
As traditional chart pattern analysis becomes increasingly unreliable in modern markets, traders are developing alternative approaches that combine classical technical analysis with contemporary market understanding. These hybrid methods often provide better results than pure pattern trading.
Algorithmic Pattern Recognition
Modern trading platforms offer algorithmic pattern recognition tools that can identify Head and Shoulders formations with greater consistency than manual analysis. These tools can also backtest pattern performance across different market conditions, providing valuable insights into when patterns are most likely to succeed or fail.
Sentiment-Driven Pattern Analysis
Incorporating sentiment analysis into pattern trading can significantly improve success rates. Head and Shoulders patterns forming during periods of extreme optimism often have higher success rates than those forming during neutral or pessimistic periods, as they represent genuine shifts in market psychology rather than temporary corrections.
Modern chart analysis showing Head and Shoulders pattern in contemporary market conditions with advanced technical indicators
The Future of Pattern Trading
The increasing sophistication of market participants and the proliferation of algorithmic trading systems are fundamentally changing how chart patterns behave. Head and Shoulders patterns, like many classical formations, are becoming less reliable as standalone trading signals but remain valuable when combined with other forms of analysis.
Integration with Quantitative Methods
The future of pattern trading lies in integrating classical formations with quantitative analysis methods. This might involve using machine learning algorithms to identify pattern variations that have higher success rates, or combining pattern recognition with statistical models that can predict pattern failure probability.
Behavioral Finance Applications
Understanding the behavioral finance principles behind pattern formation and failure can provide modern traders with a significant edge. Patterns fail not because they’re inherently flawed, but because human psychology and market structure dynamics create specific conditions that make failure more likely.
Key Takeaways for Modern Traders
- Use patterns as just one component of a comprehensive trading system
- Focus on understanding why patterns fail rather than just identifying them
- Combine traditional analysis with modern market structure understanding
- Always consider the broader market context before acting on patterns
- Implement robust risk management regardless of pattern quality
Conclusion: Mastering the Art of Pattern Failure
The Head and Shoulders pattern’s high failure rate isn’t a flaw in technical analysis—it’s a feature of modern markets that savvy traders can exploit. Understanding why these patterns fail, how to identify potential failures early, and how to profit from invalidation can transform a frustrating experience into a profitable strategy.
The key insight is that pattern failure often provides more reliable trading signals than pattern success. When a well-formed Head and Shoulders pattern fails, it usually leads to strong trending moves in the opposite direction, as trapped traders are forced to cover positions and momentum builds in the new direction.
Success in modern pattern trading requires abandoning the notion that patterns are predictive in isolation. Instead, they should be viewed as one piece of a complex market puzzle that includes sentiment, positioning, liquidity, and fundamental factors. Traders who master this multi-dimensional approach to pattern analysis will find themselves consistently ahead of those who rely on simple pattern recognition alone.
Final Trading Wisdom
Remember that the market’s primary function is to transfer money from the impatient to the patient, from the emotional to the disciplined, and from the obvious to the subtle. Head and Shoulders pattern failures are simply one manifestation of this eternal truth. Master the failure, and you’ll master the pattern.
The journey from pattern recognition to pattern mastery is long and challenging, but the rewards for those who persist are substantial. In a world where obvious opportunities are quickly arbitraged away, understanding why patterns fail may be your greatest competitive advantage.