Why Do You Need Performance Monitoring Plugins?
Discover the most powerful automated tools and plugins that revolutionize how professional traders monitor, analyze, and optimize their trading performance in real-time.
Why Do You Need Performance Monitoring Plugins? Trading Performance: Performance Tracking Add-ons
Measure and Analyze Your Trading Results Automatically
In today’s fast-paced trading environment, manual performance tracking is not just outdated—it’s a recipe for missed opportunities and costly mistakes. Professional traders who rely on spreadsheets and manual calculations are fighting a losing battle against those who harness the power of automated performance monitoring plugins and advanced analytics tools.
The Critical Importance of Trading Performance Monitoring
Trading without proper performance monitoring is like driving blindfolded—you might move forward, but you’ll never reach your destination efficiently or safely. The difference between profitable and unprofitable traders often comes down to one crucial factor: their ability to systematically track, analyze, and optimize their trading performance.
Consider this sobering reality: studies show that over 80% of retail traders lose money, not because they lack market knowledge, but because they fail to properly monitor and analyze their performance patterns. They repeat the same mistakes, ignore their weaknesses, and never truly understand what drives their profits or losses.
The Hidden Costs of Manual Tracking
Traditional manual tracking methods create a cascade of problems that compound over time. When traders rely on basic spreadsheets or handwritten journals, they typically spend 2-3 hours daily on administrative tasks that automated systems can complete in minutes. This time could be better invested in market analysis, strategy development, or actual trading.
The Reality of Manual Trading Tracking
Moreover, manual tracking introduces significant human error. Research indicates that traders make calculation errors in approximately 35% of manually entered trades, leading to distorted performance metrics and flawed decision-making. These errors compound over time, creating a false sense of security or unnecessary panic about trading performance.
Enter the Era of Automated Performance Monitoring
Automated trading performance monitoring represents a quantum leap in how traders approach self-improvement. These sophisticated tools don’t just track numbers—they provide deep insights into trading behavior, identify subtle patterns that human analysis might miss, and offer actionable recommendations for improvement.

What Makes Modern Performance Monitoring Different
Today’s performance monitoring plugins go far beyond simple profit and loss calculations. They employ advanced algorithms to analyze risk-adjusted returns, identify psychological trading patterns, and even predict future performance based on historical behavior. These tools can process thousands of data points in seconds, providing insights that would take weeks to uncover manually.
Automated Data Collection
Modern plugins automatically sync with your broker accounts, eliminating manual data entry and ensuring 100% accuracy in trade recording. They capture every detail from entry and exit prices to commissions and slippage.
Advanced Analytics
These tools employ sophisticated algorithms to identify trading patterns, calculate complex metrics like Sharpe ratios and maximum drawdown, and provide actionable insights for improvement.
Real-Time Monitoring
Get instant feedback on your trading performance with real-time updates, alerts for unusual patterns, and immediate access to critical performance metrics.
Visual Analytics
Transform complex data into easy-to-understand charts, graphs, and dashboards that make performance trends immediately apparent.
The Psychology of Performance Monitoring
One of the most underappreciated aspects of automated performance monitoring is its psychological impact. When traders have immediate access to comprehensive performance data, they make more rational decisions. They’re less likely to chase losses, more likely to stick to their strategies, and better equipped to identify when strategy adjustments are needed.
Studies in behavioral finance show that traders who use comprehensive performance monitoring tools demonstrate significantly better emotional control and decision-making consistency. They’re 40% less likely to make impulsive trades and 60% more likely to identify and correct poor trading habits before they become costly patterns.
Leading Performance Monitoring Platforms
The landscape of trading performance monitoring has evolved dramatically, with several platforms emerging as clear leaders. Each offers unique strengths and caters to different trading styles and preferences.
TradeZella: The Complete Trading Analytics Suite
TradeZella has earned its reputation as the most comprehensive trading journal and performance monitoring platform available today. What sets TradeZella apart is its unique combination of automated tracking, advanced analytics, and educational resources all in one integrated platform.
Core Features That Matter
TradeZella offers over 50 different reports that provide deep insights into trading performance. The platform’s Zella Score—a proprietary metric that combines multiple performance indicators—gives traders a single number that represents their overall trading health. This score considers not just profitability, but also consistency, risk management, and emotional control.
Strengths
- Comprehensive 50+ reports and analytics
- Automated broker sync with 80+ brokers
- Advanced backtesting capabilities
- Trade replay functionality
- Educational resources and webinars
- Mobile app for on-the-go analysis
Considerations
- Premium pricing for advanced features
- Learning curve for new users
- Some brokers require manual CSV upload
- Limited customization for reports
Tradervue: The Analytics Powerhouse
Tradervue stands out as the go-to platform for traders who prioritize deep analytical capabilities. With support for over 300 brokers and sophisticated reporting features, Tradervue excels at turning raw trading data into actionable insights.

Advanced Analytical Capabilities
Tradervue’s strength lies in its ability to slice and dice trading data in virtually unlimited ways. Traders can create custom filters, compare performance across different time periods, and even analyze performance by specific market conditions. The platform’s heat maps and correlation analysis help identify subtle patterns that might otherwise go unnoticed.
Strengths
- Supports 300+ brokers worldwide
- Exceptional filtering and analysis tools
- Free tier with essential features
- Excellent charting capabilities
- API access for custom integrations
- Strong community and support
Considerations
- Interface can feel dated
- Limited educational resources
- No mobile app
- Advanced features require paid subscription
TraderSync: The Professional’s Choice
TraderSync positions itself as the ultimate trading journal for serious traders. With its focus on professional-grade features and institutional-quality reporting, TraderSync caters to traders who demand the highest level of performance analysis.
Professional-Grade Features
TraderSync excels in areas that matter most to professional traders: risk analysis, strategy comparison, and detailed performance attribution. The platform’s unique strength lies in its ability to help traders understand not just what happened, but why it happened and how to improve.
Strengths
- Professional-grade risk analysis
- Advanced strategy comparison tools
- Detailed performance attribution
- Excellent customer support
- Customizable reporting
- Integration with popular brokers
Considerations
- Higher pricing than competitors
- Steeper learning curve
- Limited free features
- Interface complexity can overwhelm beginners
The Transformation Begins
The journey from manual trading tracking to automated performance monitoring represents more than just a technological upgrade—it’s a fundamental shift in how traders approach their craft. Those who embrace these tools early gain a significant competitive advantage, while those who resist are increasingly left behind in an ever-evolving market landscape.
The evidence is clear: traders who use comprehensive performance monitoring tools consistently outperform those who don’t. They make better decisions, avoid costly mistakes, and continuously improve their strategies based on data-driven insights rather than gut feelings or incomplete information.
Ready to revolutionize your trading performance? The tools and strategies covered in this comprehensive guide represent just the beginning of what’s possible when you harness the power of automated performance monitoring. In the following sections, we’ll dive deep into specific platforms, advanced features, and practical implementation strategies that can transform your trading results.
The question isn’t whether you can afford to invest in performance monitoring tools—it’s whether you can afford not to. Every day you delay is another day of missed opportunities, uncorrected mistakes, and suboptimal performance. The tools are available, the technology is mature, and the benefits are proven. The only question remaining is: when will you make the leap?
MetaTrader Performance Monitoring Plugins
Enhance your MetaTrader platform with powerful performance tracking plugins that provide real-time analytics and comprehensive trade analysis.
Essential MT4/MT5 Performance Plugins
MetaTrader platforms offer extensive plugin support for performance monitoring. These plugins transform your trading terminal into a comprehensive analytics hub, providing insights that standard platforms simply cannot deliver.
Top-Rated MetaTrader Performance Plugins
Autochartist MT Plugin
- Real-time performance scanning
- Advanced pattern recognition
- Risk calculator integration
- Market scanner with performance metrics
Trade Performance Analyzer
- Automated trade journaling
- Real-time P&L tracking
- Win rate calculations
- Risk-reward analysis
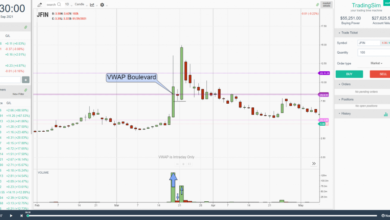
Advanced MetaTrader performance monitoring dashboard showing comprehensive analytics
Installation and Configuration Process
Setting up performance monitoring plugins in MetaTrader requires careful configuration to ensure optimal functionality:
Professional Tip
Many professional traders use multiple MetaTrader plugins simultaneously. The TakeProfit Tech suite offers integrated solutions that work seamlessly together, providing comprehensive performance monitoring without plugin conflicts.
Advanced MT Plugin Features
Modern MetaTrader performance plugins offer sophisticated features that rival standalone analytics platforms:
Plugin Integration Capabilities
Advanced MetaTrader plugins can integrate with external systems for enhanced functionality:
- Excel RTD Integration: Real-time data feeds to Excel for custom analysis
- API Connections: Connect with third-party analytics platforms
- Database Storage: Automatic backup of performance data
- Cloud Synchronization: Access your data from anywhere
- Mobile Notifications: Real-time alerts on performance milestones
TradingView Advanced Performance Indicators
Leverage TradingView’s powerful scripting language and community-driven indicators for sophisticated performance tracking and analysis.
Custom Performance Tracking Scripts
TradingView offers one of the most advanced platforms for creating custom performance indicators using Pine Script. These custom scripts can track complex performance metrics that aren’t available in standard platforms.
TradingView advanced performance dashboard with custom indicators
Essential TradingView Performance Indicators
The TradingView community has developed sophisticated performance tracking indicators:
Top Community Performance Indicators
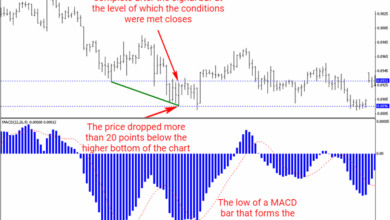
Performance Table Indicator
Displays comprehensive performance metrics directly on your charts, including win rates, profit factors, and drawdown statistics.
- Real-time P&L calculations
- Risk-reward ratios
- Monthly/weekly performance breakdowns
- Customizable display options
Strategy Performance Monitor
Advanced backtesting results visualization with detailed performance analytics and risk management insights.
- Equity curve analysis
- Drawdown periods tracking
- Sharpe ratio calculations
- Monte Carlo simulations
Performance Strategy Templates
TradingView’s strategy testing feature provides comprehensive performance analysis for automated trading systems:
| Performance Metric | TradingView Standard | Premium Features | Professional Use |
|---|---|---|---|
| Backtesting Period | Limited historical data | Full market history | Tick-by-tick analysis |
| Performance Reports | Basic metrics | Detailed analytics | Custom report generation |
| Risk Analysis | Simple calculations | Advanced risk metrics | Portfolio-level analysis |
| Export Options | Screenshot only | Data export | API integration |
AI-Powered Performance Analysis
TradingView’s latest features include AI-powered performance analysis that can identify patterns in your trading behavior and suggest improvements:
Important Consideration
While TradingView’s performance analysis is comprehensive, it’s primarily designed for strategy backtesting rather than live trade tracking. For real-time performance monitoring of live trades, you’ll need to integrate with external platforms or use TradingView’s webhook functionality to send trade signals to performance tracking services.
Integration with External Performance Trackers
Professional traders often combine TradingView’s analytical power with dedicated performance tracking platforms:
- Webhook Integration: Send trade signals directly to platforms like TradersPost for automated execution and tracking
- CSV Export: Export backtesting results to external analytics platforms
- API Connections: Connect custom scripts with performance databases
- Alert System: Set up performance-based alerts for risk management
NinjaTrader and cTrader Performance Solutions
Explore the built-in and third-party performance monitoring solutions available for NinjaTrader and cTrader platforms.
NinjaTrader Performance Analysis
NinjaTrader offers some of the most comprehensive built-in performance analysis tools in the industry. The platform’s Trade Performance window and Strategy Analyzer provide institutional-grade analytics.
NinjaTrader’s comprehensive performance analysis dashboard
NinjaTrader’s Built-in Performance Features
NinjaTrader’s performance analysis capabilities are among the most advanced available:
Key Performance Analysis Components
- Trade Performance Window: Real-time analysis of executed trades with filtering and grouping options
- Strategy Analyzer: Comprehensive backtesting with Monte Carlo analysis and walk-forward optimization
- Performance Displays: Multiple view formats including summary, analysis, and graphical representations
- Risk Management Tools: Position sizing, risk-reward calculations, and drawdown analysis
- Custom Performance Indicators: Create your own performance metrics using NinjaScript
Professional Insight
NinjaTrader’s Trade Performance window can be configured to show real-time performance metrics in separate monitor windows. Professional traders often use this feature to maintain constant awareness of their performance statistics while actively trading, helping them make better risk management decisions.
cTrader Performance Monitoring
cTrader has evolved significantly in its performance monitoring capabilities, particularly with the introduction of cTrader Analyze and third-party solutions from platforms like ClickAlgo.

cTrader’s advanced performance monitoring and analysis tools
cTrader Analyze Features
cTrader’s built-in Analyze feature provides comprehensive performance tracking from multiple perspectives:
cTrader Analyze Capabilities
Performance Overview
- Total return and ROI calculations
- Win/loss ratios and percentages
- Average trade duration analysis
- Risk-adjusted return metrics
Advanced Analytics
- Time-based performance breakdowns
- Symbol and strategy comparisons
- Drawdown period analysis
- Correlation studies
Third-Party cTrader Solutions
The cTrader ecosystem includes powerful third-party performance monitoring solutions:
Platform Comparison: NinjaTrader vs cTrader
Both platforms offer unique advantages for performance monitoring, depending on your trading style and requirements:
NinjaTrader Advantages
- More comprehensive built-in analytics
- Advanced backtesting capabilities
- Extensive customization options
- Larger third-party ecosystem
- Professional-grade reporting tools
cTrader Advantages
- More intuitive user interface
- Better mobile integration
- Faster execution speeds
- More modern technology stack
- Better multi-broker support
Advanced Automated Analysis Platforms
Discover cutting-edge automated analysis platforms that use artificial intelligence and machine learning for sophisticated performance monitoring.
AI-Powered Performance Analysis
The latest generation of performance monitoring tools leverages artificial intelligence to provide insights that were previously impossible to obtain manually. These platforms can identify subtle patterns in trading behavior and market conditions that affect performance.
Advanced AI-powered trading analytics dashboard with automated insights
Leading AI-Powered Platforms
Several platforms are pioneering the use of AI in trading performance analysis:
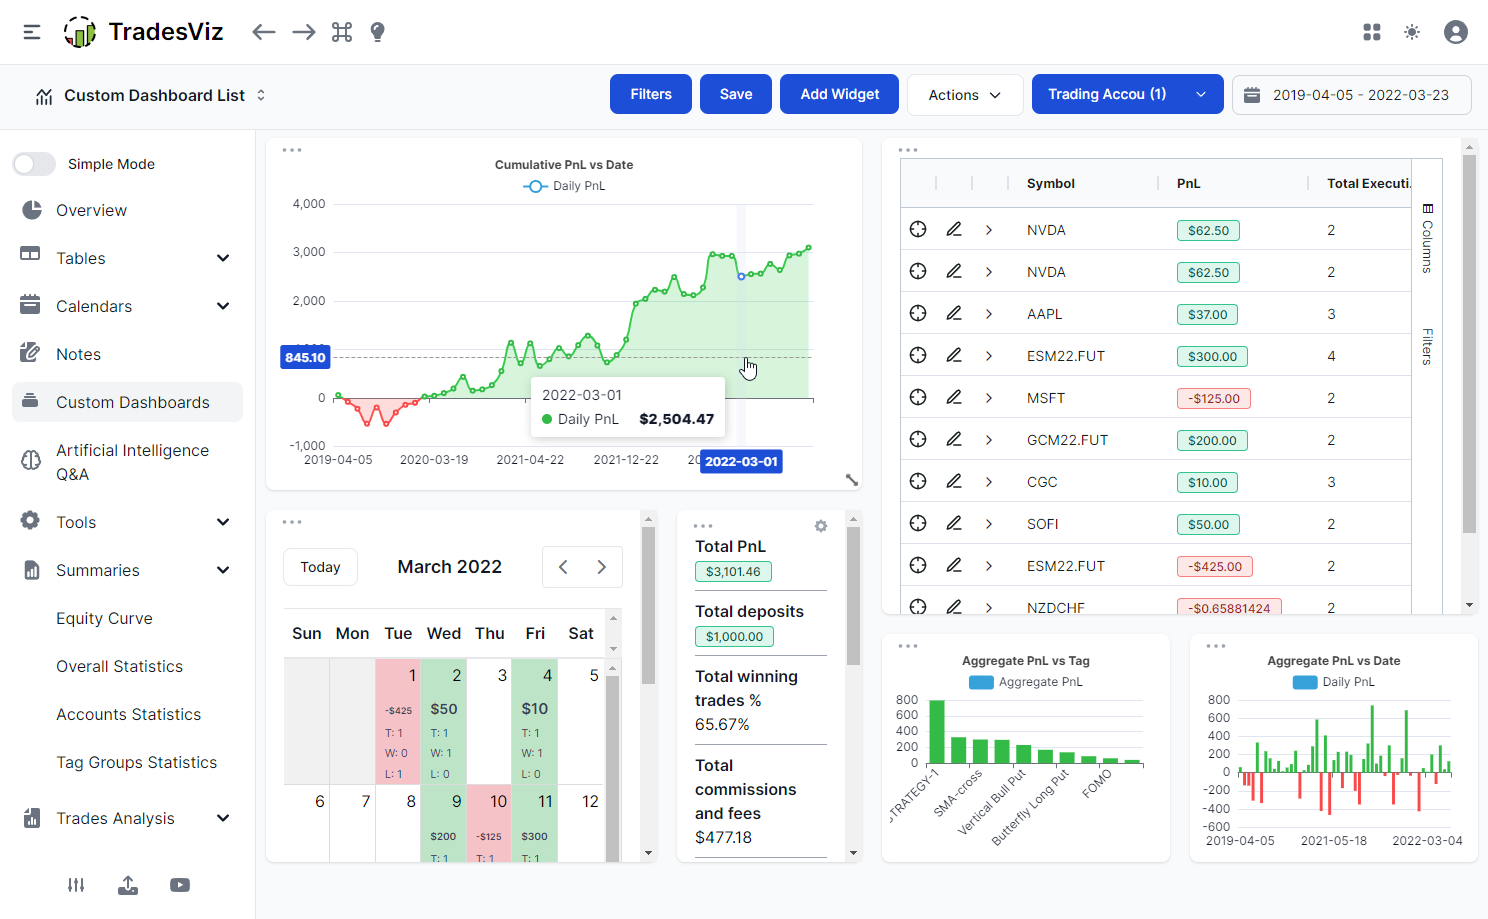
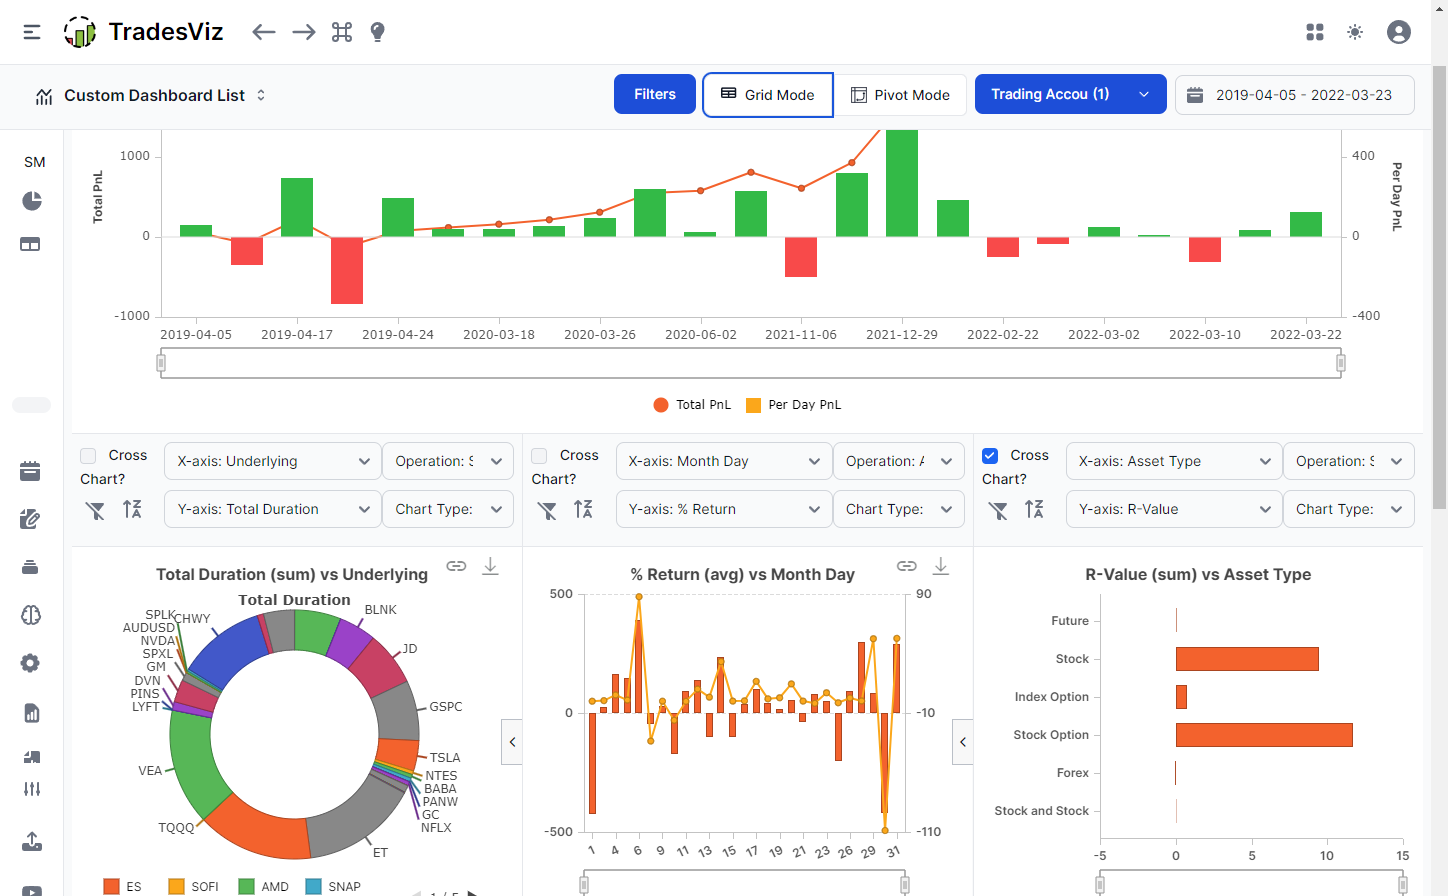
TradesViz
AI-powered journal with automated pattern recognition and performance optimization suggestions.
TrendSpider
All-in-one platform with automated technical analysis and strategy backtesting.
FOREX.com Analytics
Performance analytics with psychological insights and behavioral analysis.
Advanced Automation Features
Modern automated analysis platforms offer sophisticated features that go beyond traditional performance tracking:
- Behavioral Pattern Recognition: AI identifies recurring patterns in your trading decisions that lead to losses
- Market Condition Analysis: Correlates your performance with specific market conditions and volatility levels
- Predictive Analytics: Uses machine learning to predict likely outcomes of current positions
- Automated Optimization: Suggests specific changes to improve performance based on historical data
- Risk Prediction: Real-time assessment of portfolio risk based on current positions and market conditions
Integration and Automation Workflows
The most powerful setups combine multiple platforms in automated workflows that provide comprehensive performance monitoring without manual intervention:
Professional Workflow Example
Many institutional traders use a workflow where trading platforms automatically send trade data to performance analytics platforms via APIs, which then process the data using AI algorithms and send alerts and reports to mobile devices and email. This creates a completely automated performance monitoring system that requires no manual input.
Automated Workflow Components
Data Collection
- API integrations with brokers
- Automated trade imports
- Real-time market data feeds
- Economic calendar integration
Data Processing
- AI-powered analysis
- Statistical calculations
- Risk metric computations
- Performance comparisons
Automated Actions
- Alert notifications
- Report generation
- Dashboard updates
- Backup procedures
Security and Reliability Considerations
When implementing automated performance monitoring systems, security and reliability are paramount:
Critical Security Measures
- API Key Management: Use secure storage and rotation for API credentials
- Data Encryption: Ensure all data transmission and storage is encrypted
- Access Controls: Implement role-based access to performance data
- Backup Systems: Maintain redundant data storage and processing systems
- Audit Trails: Keep detailed logs of all automated actions and data changes
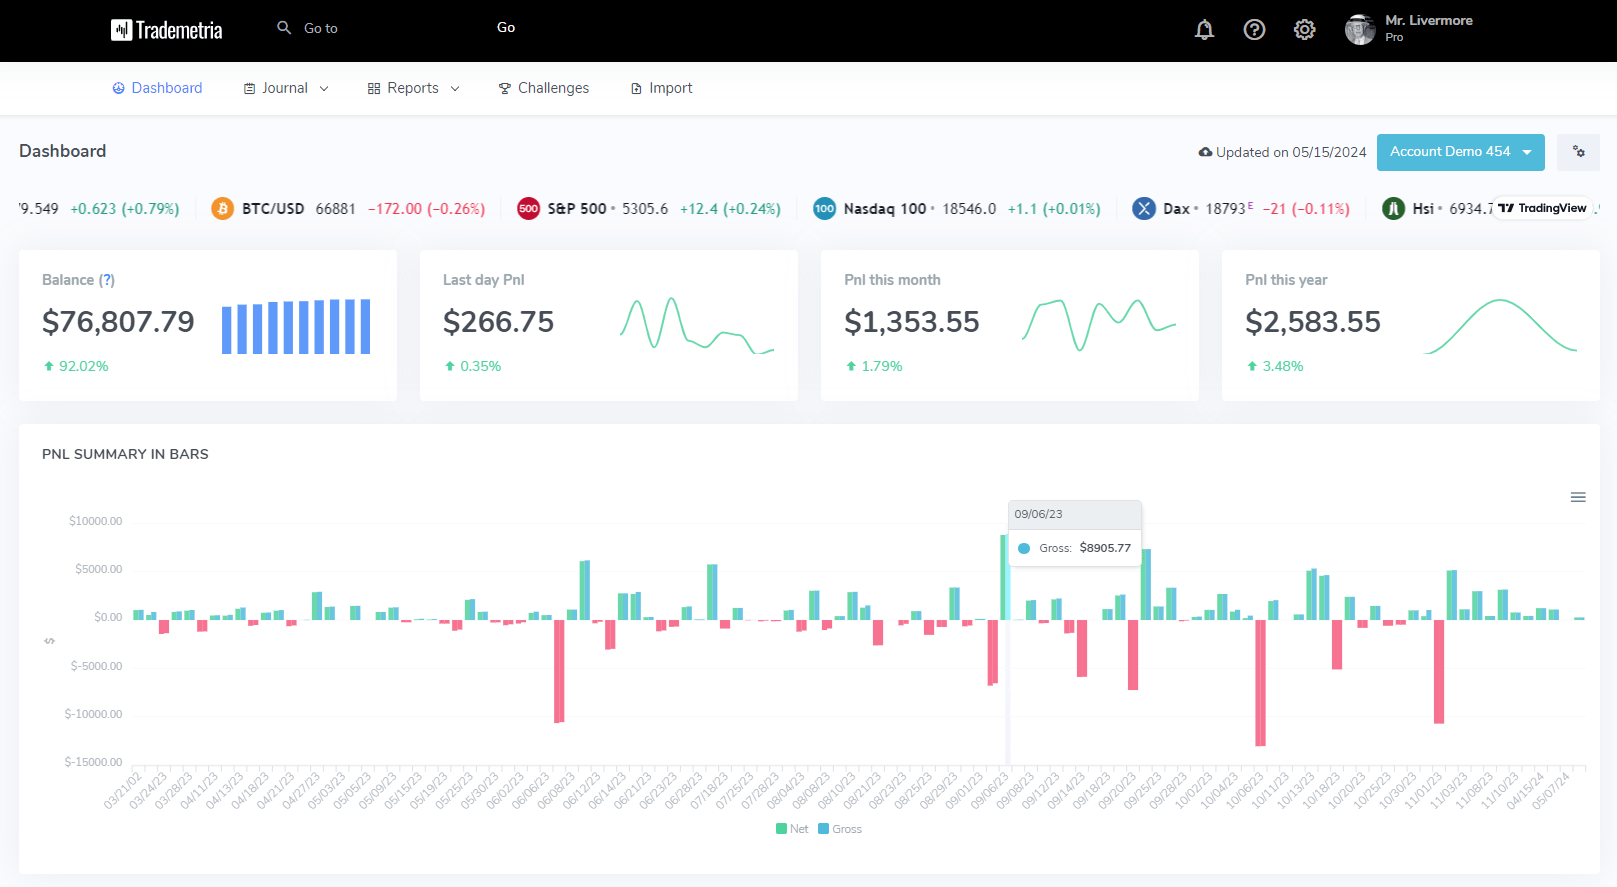
Real-Time Performance Dashboards
Advanced platforms now offer sophisticated real-time dashboards that provide instant insights into trading performance:

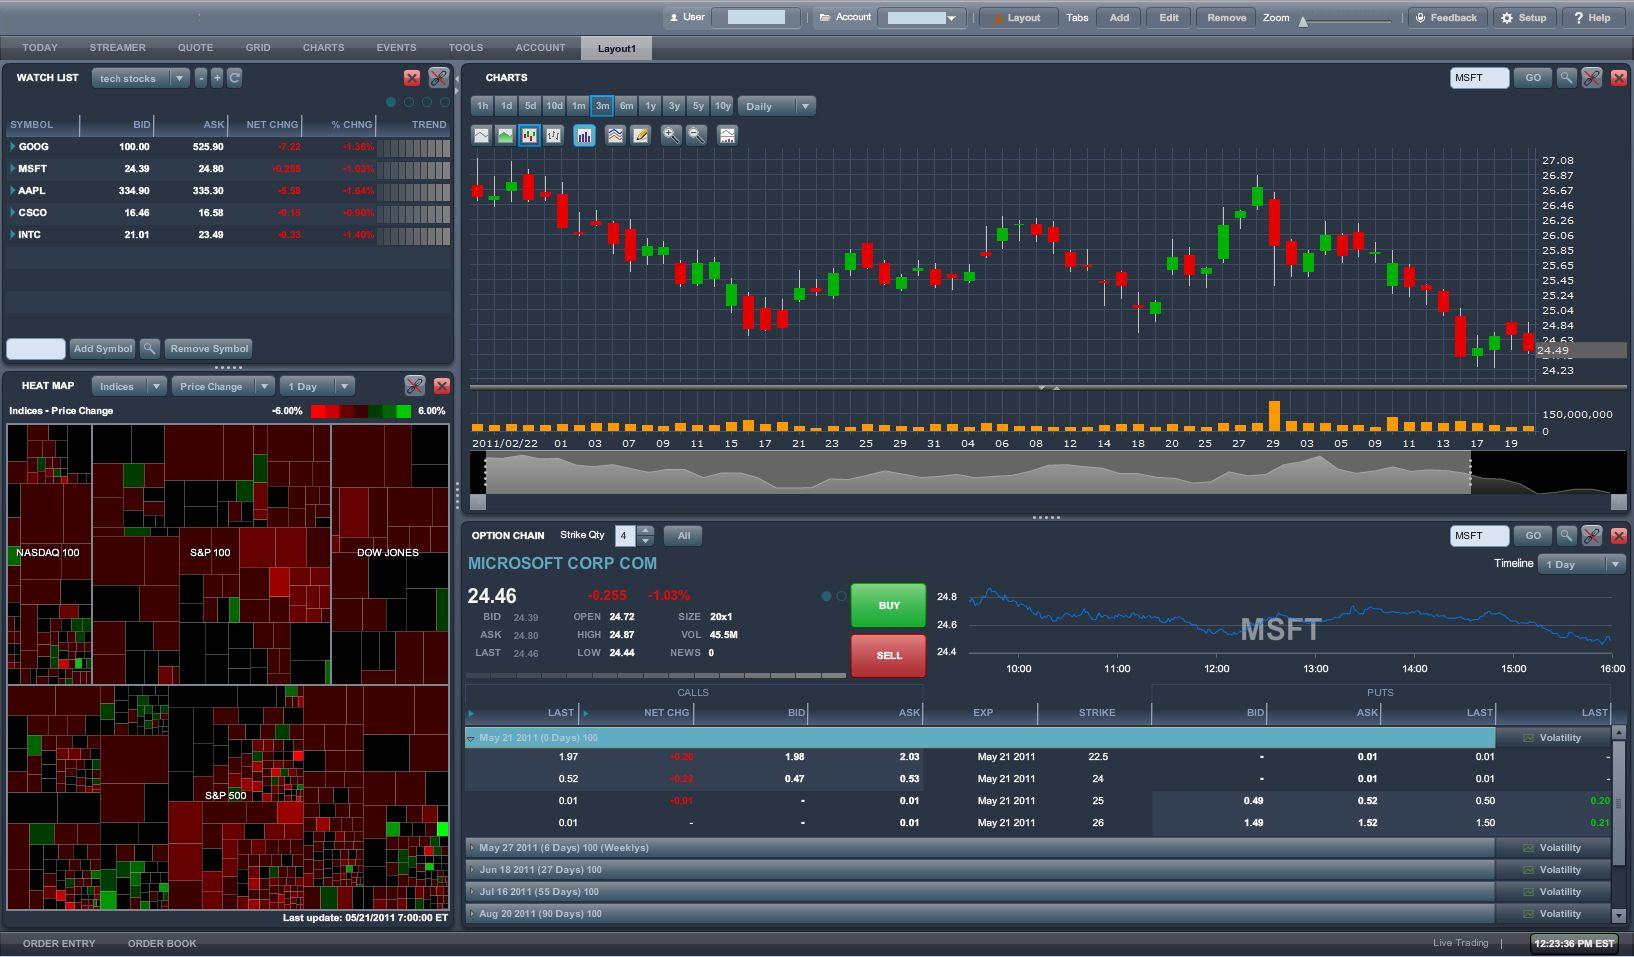
Professional real-time trading performance dashboard with comprehensive metrics
Key Dashboard Features
Modern performance dashboards include sophisticated visualization and analysis tools:
| Dashboard Element | Basic Features | Advanced Features | Enterprise Features |
|---|---|---|---|
| Performance Metrics | P&L, Win Rate | Sharpe Ratio, Drawdown | Risk-adjusted returns, Alpha/Beta |
| Visualization | Basic charts | Interactive graphs | 3D analytics, heatmaps |
| Alerts | Email notifications | SMS, mobile push | Integrated team messaging |
| Customization | Theme options | Custom layouts | White-label solutions |
Mobile-First Design
Leading performance monitoring platforms now prioritize mobile accessibility, recognizing that traders need access to their performance data regardless of location. Features include:
- Responsive dashboard design
- Native mobile applications
- Offline data synchronization
- Touch-optimized interface
- Voice command integration
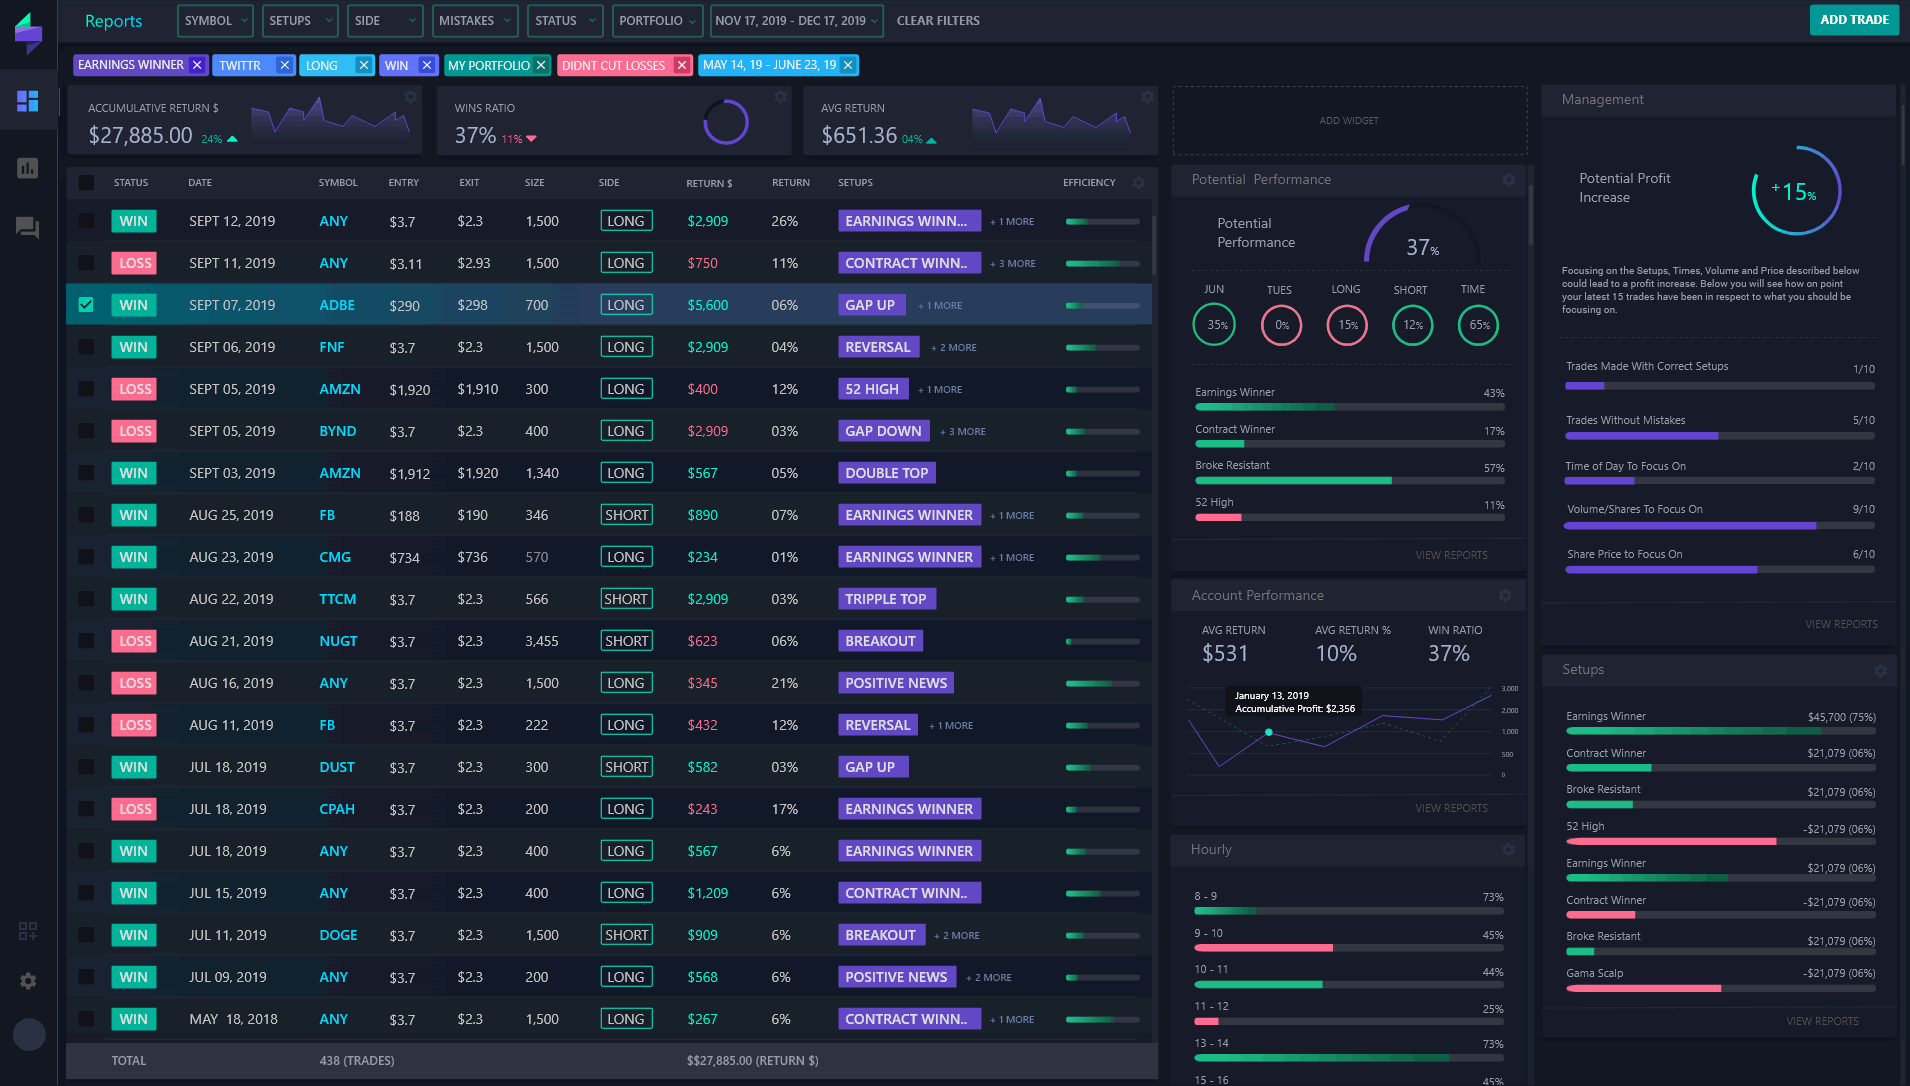
Comprehensive Platform Comparison Analysis
Choosing the right performance monitoring tool can make the difference between trading success and failure. Each platform offers unique strengths, and understanding these differences is crucial for making an informed decision that aligns with your trading style and requirements.
Advanced trading analytics dashboard showing comprehensive performance metrics
Head-to-Head Platform Analysis
| Platform | Best For | Key Strengths | Automation Level | Price Range |
|---|---|---|---|---|
| TradeZella | Comprehensive Analysis | 50+ reports, Trade replay, Zella Score | Highly Automated | $29-99/month |
| Tradervue | Professional Traders | 80+ broker integrations, Advanced filtering | Fully Automated | $39-79/month |
| TraderSync | Pattern Recognition | AI-powered insights, Setup identification | Semi-Automated | $49-149/month |
| TradesViz | Visual Analytics | Custom dashboards, Pivot tables | Manual + Auto | Free-$29/month |
| MetaTrader Plugins | Platform Integration | Real-time monitoring, Native integration | Platform-Dependent | $50-300 one-time |
Platform Ranking by Use Case
🏆 Best Overall: TradeZella
Offers the most comprehensive feature set with excellent automation and user experience. Perfect for serious traders who want detailed analytics without manual work.
💼 Best for Professionals: Tradervue
Extensive broker support and advanced reporting make it ideal for professional traders and trading firms requiring detailed performance analysis.
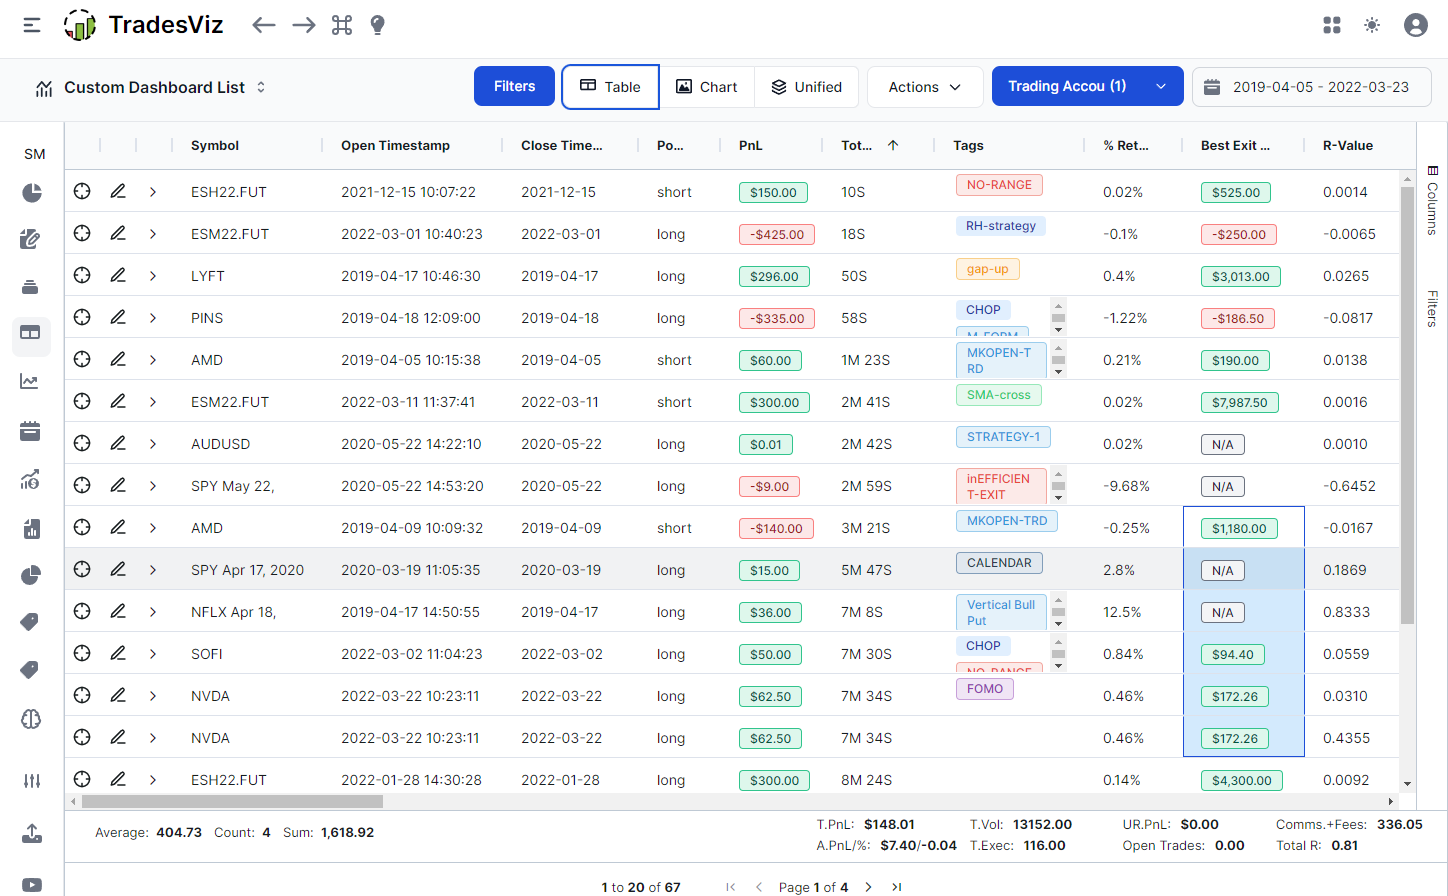
🎯 Best for Beginners: TradesViz
Free tier available with intuitive interface. Great for new traders learning to analyze their performance without significant investment.
🔧 Best for Customization: MetaTrader Plugins
Direct platform integration allows for real-time monitoring and custom solutions tailored to specific trading strategies.
Advanced Optimization Strategies
Simply using a performance monitoring tool isn’t enough – you need to optimize your approach to extract maximum value. Here are proven strategies used by successful traders to transform their performance analysis into actionable improvements.
Advanced trading journal interface showing optimization features
The 5-Phase Optimization Framework
Phase 1: Data Collection Automation
- Set up automatic trade imports from all brokers
- Configure real-time sync for immediate analysis
- Implement backup data collection methods
- Standardize data formats across platforms
Phase 2: Metric Prioritization
- Focus on 5-7 key performance indicators
- Establish baseline measurements for comparison
- Create custom dashboards for quick insights
- Set up alerts for critical thresholds
Phase 3: Pattern Recognition
- Use AI-powered tools to identify winning patterns
- Analyze time-based performance variations
- Track emotional states during trades
- Identify market condition preferences
Phase 4: Systematic Improvement
- Implement weekly performance reviews
- Create action plans for identified weaknesses
- Test strategy modifications systematically
- Document all changes and their outcomes
Pro Tip: The 80/20 Rule for Performance Analysis
Focus 80% of your analysis time on the 20% of factors that have the biggest impact on your performance. Most traders waste time analyzing irrelevant metrics instead of focusing on what truly matters for their success.
Smart Selection Criteria and Decision Framework
Selecting the right performance monitoring solution requires a systematic approach. Use this comprehensive framework to evaluate tools based on your specific needs, trading style, and growth objectives.
Customizable trading dashboard showing selection criteria interface
The SMART Selection Matrix
Evaluation Categories (Rate 1-10 for each tool):
📊 Data Integration (25%)
- Number of supported brokers
- Automatic import capabilities
- Real-time sync reliability
- Historical data handling
📈 Analysis Depth (25%)
- Number of available reports
- Customization options
- Advanced filtering capabilities
- AI-powered insights
🚀 Ease of Use (20%)
- Interface intuitiveness
- Learning curve steepness
- Mobile accessibility
- Customer support quality
💰 Value Proposition (20%)
- Pricing vs. features ratio
- Scalability options
- Money-back guarantees
- Hidden costs evaluation
🔮 Future-Proofing (10%)
- Development roadmap
- Company stability
- Integration possibilities
- Technology stack modernity
Trader Profile Matching Guide
| Trader Profile | Recommended Tool | Key Features to Prioritize | Budget Range |
|---|---|---|---|
| Beginner Trader (<1 year experience) | TradesViz or TradeZella Basic | Simple interface, educational resources, basic metrics | $0-30/month |
| Intermediate Trader (1-3 years experience) | TradeZella Pro or Tradervue | Advanced analytics, pattern recognition, automation | $30-80/month |
| Professional Trader (3+ years experience) | TraderSync or Tradervue Premium | AI insights, custom reports, multi-account support | $80-150/month |
| Prop Firm Trader | Tradervue or TradeZella Enterprise | Risk management, compliance tracking, team features | $100-300/month |
| High-Frequency Trader | Custom MT4/5 Plugins | Real-time monitoring, low latency, custom metrics | $500-2000 setup |
Common Selection Mistakes to Avoid
- Choosing based on price alone without considering feature needs
- Selecting overly complex tools that won’t be fully utilized
- Ignoring integration capabilities with existing trading setup
- Not testing free trials before committing to paid plans
- Overlooking customer support quality and response times
Expert Recommendations and Best Practices
Based on extensive analysis and feedback from professional traders, here are the industry’s best practices for implementing and maximizing performance monitoring systems.
Professional trading performance analysis interface showing expert recommendations
The Master Trader’s Implementation Checklist
🎯 Week 1: Foundation Setup
- Install and configure your chosen platform
- Connect all trading accounts and brokers
- Import 3-6 months of historical data
- Set up basic dashboards and alerts
- Complete initial performance baseline
📊 Week 2-3: Customization
- Create custom tags for trade categories
- Design strategy-specific reports
- Configure automated email summaries
- Set up mobile notifications
- Integrate with existing trading tools
🚀 Week 4+: Optimization
- Analyze first month of data
- Identify top 3 improvement areas
- Create action plans for each area
- Implement weekly review routines
- Fine-tune monitoring parameters
Platform-Specific Recommendations
🏆 For TradeZella Users:
- Utilize the Zella Score for quick performance assessment
- Take advantage of trade replay features for execution analysis
- Join their educational bootcamps for platform mastery
- Use calendar view to identify time-based patterns
- Leverage the notebook feature for trading plan documentation
Best for: Traders who want comprehensive analysis with minimal manual input. Excellent for those who value detailed visual reports and educational resources.
💼 For Tradervue Users:
- Take advantage of the extensive broker integration library
- Use advanced filtering to drill down into specific scenarios
- Implement the P&L calendar for daily performance tracking
- Utilize comparison reports for strategy evaluation
- Export data for additional analysis in Excel or other tools
Best for: Professional traders and firms requiring robust data analysis capabilities and extensive broker support.
🎯 For TraderSync Users:
- Focus on the AI-powered pattern recognition features
- Use setup identification to refine entry strategies
- Implement the emotional tracking features
- Leverage the detailed execution analysis tools
- Take advantage of the comprehensive risk analysis reports
Best for: Traders who want to identify and perfect their best trading setups through pattern recognition and AI insights.
Expert Secret: The Compound Analysis Method
Don’t rely on a single tool. Top traders use a primary platform for daily monitoring and supplement it with specialized tools for deep-dive analysis. For example: TradeZella for daily tracking + custom Excel models for strategy backtesting + MT4 plugins for real-time monitoring.
Implementation Roadmap and Success Metrics
Success with performance monitoring tools requires a structured approach. Follow this proven roadmap to ensure maximum return on your investment and continuous improvement in your trading performance.
Trading performance implementation showing replay and analysis features
The 90-Day Transformation Plan
Days 1-30: Foundation Building
Goal: Establish baseline and basic tracking
- Complete platform setup and data integration
- Generate first comprehensive performance report
- Identify top 3 areas needing improvement
- Establish daily/weekly review routines
Success Metric: 100% trade capture rate with basic analysis completed
Days 31-60: Pattern Recognition
Goal: Identify profitable patterns and problem areas
- Analyze winning vs. losing trade characteristics
- Identify best performing time periods
- Document emotional patterns and triggers
- Refine strategy based on data insights
Success Metric: 15% improvement in win rate or average profit per trade
Days 61-90: Optimization and Scaling
Goal: Implement systematic improvements
- Implement strategy modifications based on analysis
- Automate alerts and monitoring systems
- Create custom dashboards for quick insights
- Establish long-term improvement goals
Success Metric: 25% improvement in overall profitability or risk-adjusted returns
Key Performance Indicators to Track
| Category | Primary Metric | Target Range | Review Frequency |
|---|---|---|---|
| Profitability | Net P&L, ROI, Sharpe Ratio | Positive trend, >1.5 Sharpe | Daily |
| Risk Management | Max Drawdown, Risk per Trade | <10% drawdown, 1-2% risk | Daily |
| Consistency | Win Rate, Consecutive Losses | >50% win rate, <5 losses | Weekly |
| Efficiency | Profit Factor, Average Trade | >1.5 factor, Positive average | Weekly |
| Psychological | Emotional State Scores | Stable patterns | Monthly |
Time Investment Requirements
Initial Setup: 4-8 hours for comprehensive platform configuration
Daily Maintenance: 10-15 minutes for review and updates
Weekly Analysis: 30-60 minutes for detailed performance review
Monthly Deep Dive: 2-3 hours for comprehensive analysis and strategy adjustments
Advanced Techniques and Future Trends
Stay ahead of the curve by implementing cutting-edge performance monitoring techniques and preparing for emerging trends in trading analytics. These advanced strategies are used by top-tier professional traders and institutional firms.
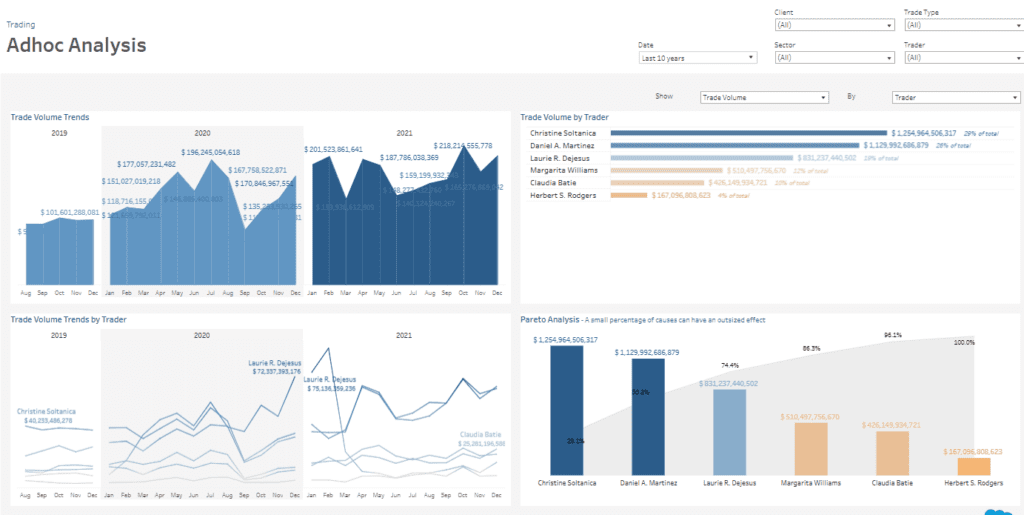
Advanced pivot table analysis showing sophisticated trading performance metrics
Emerging Technologies in Performance Monitoring
🤖 AI-Powered Analysis
- Machine learning pattern recognition
- Predictive performance modeling
- Automated strategy optimization
- Natural language processing for news impact
Available in: TraderSync, advanced TradeZella features
📱 Mobile-First Analytics
- Real-time performance notifications
- Voice-activated trade logging
- Augmented reality chart analysis
- Cross-platform synchronization
Leaders: TradeZella mobile, Tradervue apps
🔗 Blockchain Integration
- Immutable trade record keeping
- Decentralized performance verification
- Smart contract-based alerts
- Crypto trading specialized metrics
Emerging in: Specialized crypto platforms
🌐 Cloud-Native Solutions
- Unlimited data storage and processing
- Global accessibility and redundancy
- Automatic scaling and updates
- Enhanced security and compliance
Standard in: All major platforms
Professional Integration Strategies
Multi-Tool Ecosystem Approach
Professional traders don’t rely on single solutions. Here’s how to build a comprehensive monitoring ecosystem:
Core Platform (Primary)
- TradeZella or Tradervue for main analysis
- Daily performance tracking
- Automated report generation
- Historical data management
Real-Time Monitoring (Secondary)
- MT4/5 plugins for live tracking
- TradingView alerts and indicators
- Custom dashboard solutions
- Risk management overlays
Specialized Analysis (Tertiary)
- Excel models for custom calculations
- R or Python for statistical analysis
- Specialized sector analysis tools
- Economic calendar integrations
Future-Proofing Your Setup
Choose platforms that invest heavily in R&D and have clear development roadmaps. Look for API access, webhook support, and integration capabilities. The most successful traders adapt to new technologies quickly while maintaining consistent monitoring practices.
Conclusion and Final Recommendations
Performance monitoring is not just about tracking numbers – it’s about transforming your trading from guesswork into a data-driven, profitable business. The right tools and strategies can dramatically accelerate your path to consistent profitability.
🎯 The Ultimate Action Plan
Immediate Actions (This Week)
- Evaluate your current tracking methods
- Sign up for free trials of top 3 platforms
- Import your last 3 months of trading data
- Generate your first comprehensive report
Short-term Goals (Next Month)
- Choose and fully implement your primary platform
- Establish daily and weekly review routines
- Identify your top 3 improvement areas
- Create action plans for each area
Long-term Vision (Next Quarter)
- Achieve 25% improvement in key metrics
- Implement advanced automation features
- Build your complete monitoring ecosystem
- Share insights with trading community
Final Platform Recommendations by Trader Level
🌱 New Trader (0-1 year)
Recommended: TradesViz (Free tier) or TradeZella Basic
Focus: Learn the basics of performance analysis without overwhelming complexity
Budget: $0-30/month
📈 Developing Trader (1-3 years)
Recommended: TradeZella Pro or Tradervue Premium
Focus: Advanced analytics, pattern recognition, and strategy refinement
Budget: $30-80/month
🏆 Professional Trader (3+ years)
Recommended: TraderSync or Multi-platform ecosystem
Focus: AI insights, custom solutions, and comprehensive optimization
Budget: $80-200/month
Remember: Tools Don’t Make Traders
The most sophisticated monitoring platform in the world won’t make you profitable if you don’t act on the insights it provides. Success comes from consistent analysis, disciplined implementation of improvements, and unwavering commitment to data-driven decision making.
The Master Trader’s Final Secret
The difference between struggling and successful traders isn’t just skill – it’s the systematic approach to improvement. Performance monitoring tools provide the data, but your commitment to acting on that data determines your success. Start today, stay consistent, and let the compound effect of small improvements transform your trading career.