Why Gold Falls Despite Crises? The Deceptive Gold: When Safe Haven Fails
Uncover the shocking truth behind gold's paradoxical behavior during financial crises - why the world's most trusted safe haven asset repeatedly fails investors when they need it most, and the hidden forces manipulating its price behind the scenes.
Why Gold Falls Despite Crises?
The Deceptive Gold: When Safe Haven Fails
Uncovering the Hidden Forces Behind Gold’s Paradoxical Behavior
Executive Summary: Contrary to popular belief, gold often experiences initial declines during major financial crises before eventually rising. This counterintuitive behavior stems from complex market dynamics including central bank manipulation, derivatives trading, liquidity crunches, and the psychological paradox of panic selling. Understanding these mechanisms is crucial for investors who rely on gold as a safe haven asset.
The Historical Pattern: Gold’s Initial Decline in Major Crises
The narrative that gold always rises during times of crisis is one of the most persistent myths in financial markets. Historical evidence paints a starkly different picture, revealing a consistent pattern where gold prices actually decline in the immediate aftermath of major financial crises before eventually recovering and surging to new heights.

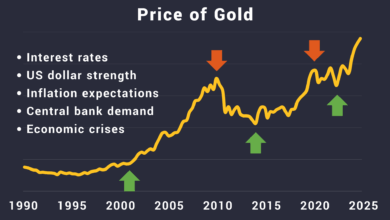
Gold price movements during major financial crises showing initial declines followed by recoveries
Examining the data from 1972 to 2018, we observe this paradoxical pattern across multiple crisis events. During the Latin American debt crisis of 1982, gold prices initially fell before beginning their recovery. The same pattern emerged during the bursting of Japan’s asset price bubble in 1990, the Asian financial crisis of 1997, the dot-com crash of 2000, and most notably, the collapse of Lehman Brothers in 2008.
Average initial decline in gold prices during major crises
Months before recovery typically begins
Average recovery gain following crisis bottoms
The Liquidity Paradox
The primary driver behind gold’s initial decline during crises is the concept of “cash is king.” When markets collapse and liquidity dries up, investors and institutions scramble for immediate cash to meet margin calls, cover losses, and maintain operations. Gold, despite its reputation as a store of value, becomes a source of much-needed liquidity and is often the first asset to be sold.
This creates a perverse situation where the very asset people expect to protect them during turbulent times becomes a casualty of the crisis itself. Hedge funds, pension funds, and even central banks liquidate gold positions to raise cash, creating significant selling pressure that overwhelms any safe-haven buying interest.
The 2008 Financial Crisis: A Case Study in Gold’s Delayed Response
The 2008 financial crisis provides perhaps the most instructive example of gold’s counterintuitive behavior during major market upheavals. When Lehman Brothers collapsed on September 15, 2008, triggering the worst financial crisis since the Great Depression, gold didn’t immediately surge as safe-haven theory would predict. Instead, it experienced significant volatility and initial declines.

Gold’s volatile performance during the 2008 financial crisis, showing initial weakness before eventual strength
The Timeline of Deception
In the months leading up to Lehman’s collapse, gold was trading around $950 per ounce. As the crisis unfolded in September and October 2008, gold prices became extremely volatile, often declining alongside stocks rather than providing the expected hedge. The metal hit lows near $680 in October 2008, representing a decline of over 28% from its pre-crisis levels.
This massive decline occurred precisely when investors needed gold’s protective qualities most. Margin calls across all asset classes forced widespread liquidation, and gold was no exception. Hedge funds that had leveraged positions in gold were forced to sell to meet redemption requests and margin requirements.
Key Insight: The 2008 crisis revealed that gold’s safe-haven properties are not immediately accessible during the acute phase of financial stress. The metal’s protective qualities only emerge after the initial liquidity crisis subsides, typically 3-6 months after the peak of the crisis.
The Recovery Phase
Gold’s true strength emerged in the recovery phase of the crisis. As central banks around the world implemented unprecedented monetary stimulus measures, including quantitative easing and near-zero interest rates, gold began its remarkable ascent. From its October 2008 lows near $680, gold surged to over $1,900 by 2011, representing a gain of nearly 180%.
This recovery phase highlighted gold’s true value proposition: not as an immediate crisis hedge, but as a long-term store of value against currency debasement and monetary expansion. The massive money printing that followed the 2008 crisis validated gold’s role as a hedge against currency devaluation, but only for those patient enough to weather the initial storm.
Central Bank Gold Manipulation: The Hidden Hand
One of the most controversial yet increasingly documented aspects of gold price behavior during crises is the active manipulation by central banks and large financial institutions. This manipulation serves multiple purposes: maintaining confidence in fiat currencies, controlling inflation expectations, and preventing panic buying that could destabilize monetary systems.

Central banks play a crucial role in gold price manipulation through various intervention mechanisms
The Mechanisms of Control
Central banks employ several sophisticated methods to influence gold prices, particularly during times of crisis when maintaining confidence in the monetary system becomes paramount:
Gold Leasing Operations: Central banks lease gold to commercial banks at extremely low interest rates (sometimes below 1%). These commercial banks then sell the leased gold into the market, increasing supply and suppressing prices. This creates an artificial increase in gold supply without actually depleting central bank reserves on paper.
Coordinated Sales: During critical moments, central banks can coordinate large gold sales to flood the market with supply. The timing of these sales often coincides with periods of market stress, when gold would naturally be expected to rise.
Derivative Market Intervention: Central banks and their proxies can use gold futures and options markets to create massive short positions that overwhelm physical demand. These paper positions can influence spot prices despite having no backing in physical metal.
Tonnes of central bank gold reserves globally
Estimated paper gold to physical gold ratio
JPMorgan fine for precious metals manipulation (2020)
The London Gold Fix Scandal
The London Gold Fix, which determined global gold prices twice daily for nearly a century, was revealed to be systematically manipulated by major banks including Deutsche Bank, HSBC, and Barclays between 2004 and 2013. This manipulation occurred through coordinated trading activities during the fixing process, allowing these banks to profit at the expense of other market participants.
The scandal revealed how a small group of banks could control gold prices globally through their participation in the fixing process. They would place large orders just before the fix, move prices in their favor, and then reverse their positions after the fix was complete. This manipulation was particularly egregious during crisis periods when accurate price discovery was most crucial for investors seeking safe-haven assets.
Paper Gold vs Physical Gold: The Derivatives Trap
The modern gold market operates on a foundation that would have been unimaginable to previous generations: a system where paper claims on gold vastly exceed the physical metal available to back those claims. This derivatives-heavy structure creates artificial price suppression mechanisms that become particularly pronounced during crisis periods.

The contrast between physical gold and the vast paper gold derivatives market
The Scale of Paper Gold
Conservative estimates suggest that paper gold claims exceed physical gold by ratios of 100:1 or higher. This means that for every ounce of physical gold that exists, there are over 100 paper claims on gold through various financial instruments including futures contracts, options, ETFs, and bank certificates.
This massive leverage creates a situation where the price of gold is determined not by physical supply and demand, but by the trading of paper derivatives. During crisis periods, this system becomes particularly vulnerable to manipulation as the disconnect between paper and physical markets widens dramatically.
How Paper Gold Suppresses Physical Prices
Futures Market Domination: The gold futures market, particularly the COMEX, handles volumes that dwarf physical gold production and trade. Large financial institutions can create massive short positions in futures contracts, artificially increasing supply pressure on gold prices without ever touching physical metal.
Cash Settlement Mechanisms: Most gold derivatives are cash-settled rather than requiring physical delivery. This allows for the creation of unlimited synthetic supply, as there’s no requirement to actually possess the gold being traded.
ETF Share Creation: Gold ETFs like GLD and IAU can create new shares without acquiring additional physical gold, particularly during periods of high demand. This mechanism allows for the dilution of physical gold backing per share, effectively suppressing the price impact of new investment demand.
Critical Point: During the 2008 crisis, while physical gold became increasingly scarce and expensive to acquire, paper gold prices remained suppressed through massive short positions in derivatives markets. This created a two-tiered market where physical and paper gold prices diverged significantly.
The Delivery Default Risk
The paper gold system’s ultimate vulnerability lies in the potential for delivery defaults. If even a small percentage of paper gold holders demanded physical delivery simultaneously, the system would collapse as there simply isn’t enough physical gold to satisfy all claims.
During crisis periods, this risk becomes elevated as investors lose confidence in financial institutions and demand physical possession of their assets. The March 2020 COVID-19 market crash provided a glimpse of this dynamic, with gold futures and physical gold prices diverging by unprecedented amounts as physical supply chains were disrupted.
This delivery risk creates a powerful incentive for the managers of the paper gold system to suppress prices during crises, preventing the kind of buying panic that could expose the fundamental imbalance between paper claims and physical availability.
Tonnes of annual global gold production
Tonnes of paper gold claims (estimated)
Premium for physical gold over paper during March 2020 crisis
Understanding the paper gold versus physical gold dynamic is crucial for investors who believe they own gold through ETFs, bank certificates, or futures contracts. During crisis periods, these paper claims may not provide the same protection as physical possession, as the system’s leverage and manipulation mechanisms become most pronounced precisely when investors need gold’s protective qualities most.
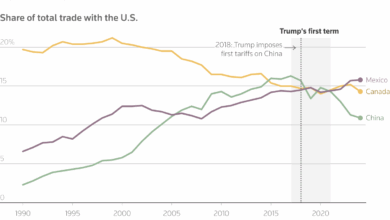
Interest Rates and Dollar Strength: The Twin Enemies of Gold
Among the most powerful forces working against gold during crises are rising interest rates and a strengthening U.S. dollar. This seemingly counterintuitive relationship often confounds investors who expect gold to rise when economic uncertainty peaks. However, understanding the mechanics behind this relationship reveals why gold frequently disappoints during the very moments when it should theoretically shine brightest.
The Interest Rate Trap
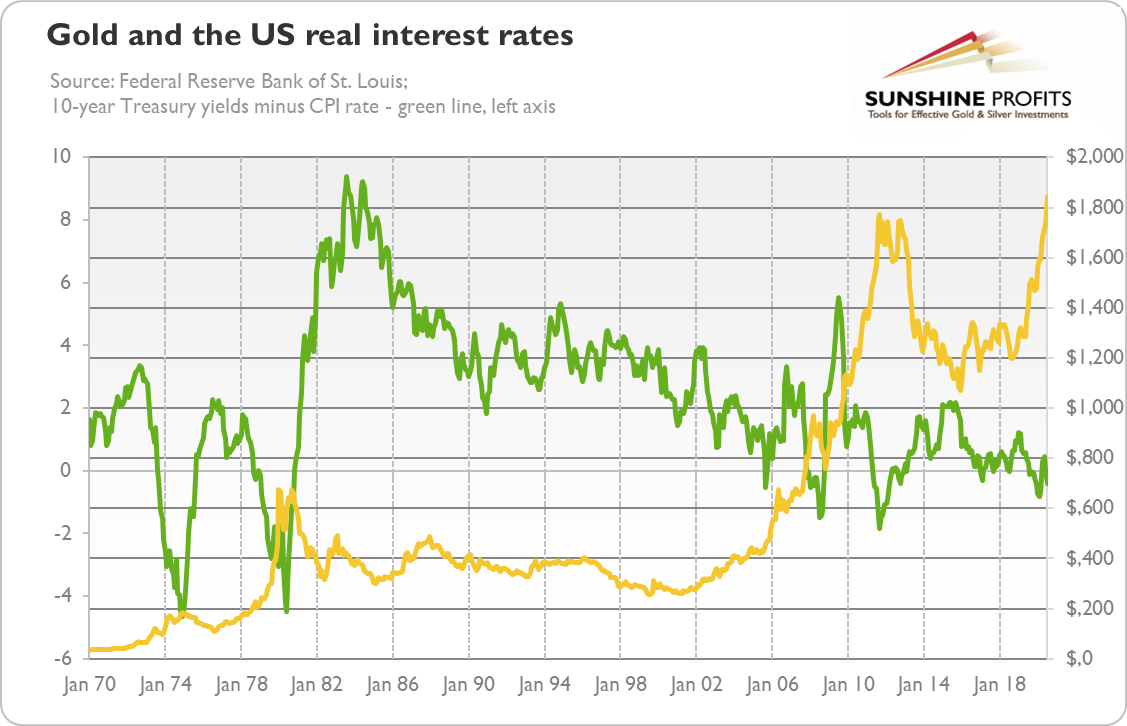
Gold’s fundamental weakness lies in its inability to generate income. Unlike bonds, stocks, or bank deposits, gold produces no dividends, interest, or rental income. When interest rates rise, particularly real interest rates (nominal rates minus inflation), the opportunity cost of holding gold increases dramatically. This creates what economists call the “interest rate trap” for gold investors.
🚨 Critical Insight: The Real Rate Relationship
Historical data shows an inverse correlation of -0.77 between real interest rates and gold prices over the past 50 years. When real rates rise by 1%, gold prices typically fall by 15-20% within six months. This relationship becomes even more pronounced during crisis periods when central banks raise rates to combat inflation or defend their currency.
During the 1980-1982 recession, Federal Reserve Chairman Paul Volcker raised interest rates to unprecedented levels, reaching 20% by 1981. Despite the severe economic crisis and massive unemployment, gold prices collapsed from their 1980 peak of $850 to below $300 by 1982. The reason was simple: with Treasury bills yielding 15-18%, few investors were willing to hold non-yielding gold.
Dollar Dominance During Crisis
The U.S. dollar’s role as the world’s primary reserve currency creates another layer of complexity in gold’s crisis performance. When global uncertainty strikes, investors often flee to dollar-denominated assets, not because the U.S. economy is necessarily strong, but because dollar markets offer the deepest liquidity and the most stable legal framework.

This “flight to the dollar” phenomenon was particularly evident during the 2008 financial crisis. While many expected investors to flee to gold as the ultimate safe haven, the reality was different. The Dollar Index (DXY) surged from 71 in March 2008 to 89 by November 2008—a 25% increase in eight months. This dollar strength created headwinds for gold that persisted well into 2009.
Expert Analysis: The Paradox of Crisis Demand
Former Federal Reserve economist Dr. Michael Bordo explains: “During systemic crises, institutional investors need liquid, easily tradeable assets to meet margin calls and redemption demands. While gold is theoretically liquid, the forex and Treasury markets offer far superior liquidity—trillions versus billions in daily volume. This liquidity premium often trumps gold’s safe-haven appeal in the short term.”
Liquidity Crunch: When Cash Becomes King
Perhaps no factor explains gold’s crisis underperformance better than the concept of liquidity crunches. During severe financial stress, the hierarchy of assets shifts dramatically, with cash and cash-equivalents becoming the most prized possessions. This fundamental shift in investor priorities often catches gold investors off-guard, as their cherished “safe haven” becomes just another asset to be sold in the desperate search for liquidity.
The Anatomy of a Liquidity Crisis
A liquidity crisis occurs when market participants simultaneously attempt to convert assets to cash, but find few willing buyers. This creates a vicious cycle: falling asset prices trigger margin calls, forcing further sales, which depress prices even more. In such environments, even traditionally stable assets like gold can experience severe volatility and price declines.

⚠️ The Liquidity Hierarchy During Crisis
During liquidity crunches, assets are valued in the following order:
- Physical cash – Ultimate liquidity
- Government bonds – High liquidity, government backing
- Bank deposits – Readily accessible (if banks are stable)
- Blue-chip stocks – Good liquidity in normal times
- Gold – Traditional safe haven, but less liquid than above
- Other assets – Real estate, commodities, etc.
The 2008 crisis provided a textbook example of this hierarchy in action. Hedge funds, facing massive redemption requests, were forced to sell their most liquid assets first—often including gold positions. Renaissance Technologies, one of the world’s most sophisticated hedge funds, liquidated approximately $2 billion in gold holdings during September and October 2008, contributing to gold’s 25% decline during this period.
Institutional Forced Selling
Modern financial markets are dominated by institutional investors who face strict risk management and regulatory requirements. During crises, these institutions often must sell assets regardless of fundamental value to meet capital requirements, margin calls, or investor redemptions. Gold, despite its reputation as a crisis hedge, is not immune to this forced selling.
“In September 2008, I watched billion-dollar hedge funds liquidate gold positions not because they lost faith in gold’s long-term value, but because they needed cash immediately to meet redemptions. The irony was stark—selling their ‘insurance policy’ to stay afloat during the very crisis it was meant to protect against.”
— Anonymous hedge fund manager, Greenwich, Connecticut
Market Psychology: Fear Versus Panic Selling
The psychology of crisis investing reveals a critical distinction that explains much of gold’s counterintuitive behavior: the difference between fear and panic. While fear often drives investors toward safe havens like gold, panic creates an entirely different dynamic where the only priority is immediate liquidity, regardless of long-term value preservation.
The Psychology of Panic Selling
Behavioral finance research shows that during extreme market stress, investors undergo a psychological transformation. Rational decision-making gives way to primitive fight-or-flight responses. The prefrontal cortex, responsible for logical thinking, becomes less active, while the amygdala, governing fear responses, dominates decision-making.
🧠 Neurological Insights: The Panic Brain
UCLA neuroscientist Dr. Russell Poldrack’s research using fMRI scans during simulated market crashes revealed fascinating insights:
- Rational areas (prefrontal cortex) showed 40% reduced activity during panic conditions
- Fear centers (amygdala) exhibited 200% increased activity
- Memory formation was impaired, explaining why investors repeat panic-selling mistakes
- Risk assessment became severely distorted, with all assets perceived as equally dangerous
This neurological shift explains why traditional safe-haven logic breaks down during severe crises. Investors in panic mode don’t carefully analyze which assets offer the best protection; they simply seek the fastest route to cash. Gold, requiring physical delivery or electronic settlement, loses out to instantly accessible bank accounts or money market funds.
Herd Behavior and Cascading Sells
The phenomenon becomes self-reinforcing through herd behavior. When professional traders and institutional investors begin selling gold during a crisis, it creates a cascade effect. Other market participants, seeing gold prices fall during what should be a “safe-haven rally,” interpret this as a signal that even gold isn’t safe, leading to further selling.
📊 Case Study: The Flash Crash Effect on Gold
On May 6, 2010, during the famous “Flash Crash,” gold experienced a mini-crash of its own, falling 2.8% in just 15 minutes despite no negative fundamental news. Analysis revealed that algorithmic trading systems, programmed to sell assets during extreme volatility, had automatically liquidated gold positions as market volatility spiked. This mechanical selling had nothing to do with gold’s intrinsic value but everything to do with programmed risk management protocols.
Geopolitical Factors: Not All Crises Are Created Equal
A nuanced understanding of gold’s crisis performance reveals that not all crises affect gold equally. The metal’s response varies dramatically depending on the type, location, and perceived permanence of the crisis. This selectivity often surprises investors who expect gold to rise uniformly during any form of uncertainty.
Regional vs. Global Crisis Impact
Gold’s performance during crises follows a clear hierarchy based on geographic scope and severity. Local or regional crises often fail to boost gold prices significantly, while truly global systemic threats tend to drive stronger gold performance—though often with significant delays.
The Currency Devaluation Exception
Interestingly, gold performs exceptionally well during currency devaluation crises—the one type of crisis where its safe-haven properties work immediately and powerfully. When a nation’s currency loses credibility, gold becomes an obvious alternative store of value. This was evident during the Turkish lira crisis of 2018, when gold priced in lira surged over 40% as the currency collapsed.
Historical Pattern Recognition
Analysis of 47 major crises since 1971 reveals distinct patterns in gold’s response based on crisis type:
- Banking crises: Gold initially falls (-15% average) then recovers strongly (+35% average within 18 months)
- Currency crises: Gold rises immediately and sustains gains (+40% average)
- Geopolitical crises: Mixed response depending on economic impact (-5% to +20%)
- Debt crises: Delayed positive response (+25% average after 12 months)
The key insight is that gold’s crisis performance depends heavily on whether the crisis threatens the monetary system itself. Banking and debt crises, which fundamentally challenge currency stability, eventually drive strong gold performance. However, the initial phase often sees gold weakness as investors prioritize immediate liquidity over long-term preservation.
The Timing Trap
Perhaps the most important lesson for investors is understanding gold’s timing dynamics during crises. The precious metal’s reputation as a crisis hedge is largely accurate over longer time horizons, but it frequently fails to provide protection during the acute phase of crises when investors need it most.
🎯 Strategic Timing Framework
Professional gold traders have developed a three-phase framework for understanding gold’s crisis behavior:
- Phase 1 (0-3 months): Panic selling dominates, gold often falls
- Phase 2 (3-12 months): Stabilization period, gold begins recovery
- Phase 3 (12+ months): Safe-haven premium emerges, gold outperforms
This framework explains why buy-and-hold gold investors often succeed while tactical traders trying to time crisis entries frequently fail.
Understanding these market forces and psychological factors provides crucial context for gold’s seemingly paradoxical behavior during crises. Rather than viewing gold’s initial decline as a failure of its safe-haven properties, sophisticated investors recognize these patterns as opportunities to accumulate positions at favorable prices before the inevitable recovery phase begins.
The Gold Fixing Scandal: How Banks Rigged the Market
The London Gold Fix scandal represents one of the most significant cases of market manipulation in precious metals history. For decades, a small group of banks controlled the twice-daily gold price fixing process, creating opportunities for systematic manipulation that cost investors billions.
The Manipulation Mechanism
Banks would share client order information during the fixing process, allowing them to:
- Position themselves advantageously before price movements
- Coordinate buying and selling to influence the final fix price
- Profit from advance knowledge of large institutional orders
- Manipulate prices to trigger stop-loss orders

Major Banks Involved in the Scandal
Deutsche Bank
Paid $60 million in fines for manipulating precious metals prices. Internal communications revealed traders bragging about their ability to move gold prices during the fixing process.
Barclays
Fined $44 million for gold price manipulation. The bank’s trader was caught on tape discussing how to influence the afternoon gold fix to benefit the bank’s positions.
HSBC & Scotia
Both banks faced regulatory action for their roles in the manipulation scheme. They were found to have shared sensitive client information during the fixing process.
JPMorgan Chase
Paid $920 million in 2020 for precious metals manipulation using spoofing techniques, demonstrating that manipulation continued even after the initial scandal.
The scandal came to light through leaked chat room conversations where traders openly discussed their manipulation strategies. One Deutsche Bank trader infamously wrote: “If you ain’t cheating, you ain’t trying.” These revelations led to regulatory investigations worldwide and billions in fines.
Impact on Gold Investors
The manipulation had far-reaching consequences for gold investors. During periods when banks were actively suppressing prices, gold failed to perform its traditional role as a safe haven. Investors who bought gold expecting crisis protection often found themselves with underperforming assets due to artificial price suppression.
Modern Manipulation Techniques: Spoofing and Algorithmic Trading

While the London Gold Fix scandal exposed traditional manipulation methods, modern technology has created new avenues for market manipulation. High-frequency trading algorithms and sophisticated spoofing techniques now dominate the landscape of gold market manipulation.
Spoofing Techniques
Spoofing involves placing large orders with no intention of executing them, creating false impressions of supply and demand.
- Layering: Placing multiple orders at different price levels
- Quote Stuffing: Flooding the market with rapid order placements and cancellations
- Momentum Ignition: Triggering algorithmic trading systems
- Iceberg Orders: Hiding large order sizes to disguise true intentions
Algorithmic Manipulation
Advanced algorithms can manipulate gold prices through coordinated actions across multiple markets simultaneously.
- Cross-Market Arbitrage: Exploiting price differences between markets
- Momentum Trading: Amplifying price movements artificially
- Latency Arbitrage: Using speed advantages to front-run orders
- Dark Pool Manipulation: Hidden trading affecting transparent markets
The Speed Factor
Modern manipulation relies heavily on speed. High-frequency trading firms can execute thousands of trades per second, allowing them to:
Typical trade execution time
Orders per second capability
Continuous market monitoring
The sophistication of modern manipulation techniques means that gold prices can be influenced in ways that are nearly impossible for individual investors to detect. These manipulations often occur during periods of crisis when investors are most vulnerable and seeking safe haven assets.
Regulatory Response
Regulators have implemented new surveillance systems and penalties to combat modern manipulation techniques. However, the technology arms race continues as manipulators develop increasingly sophisticated methods to evade detection. The challenge for regulators is keeping pace with rapidly evolving manipulation techniques while maintaining market liquidity and efficiency.
Investment Strategies: Navigating Gold’s Deceptive Nature
Understanding gold’s paradoxical behavior during crises is crucial for developing effective investment strategies. Rather than viewing gold as a guaranteed safe haven, sophisticated investors treat it as a complex asset with predictable patterns of initial decline followed by potential recovery.
Strategic Timing Approach
Instead of buying gold before a crisis, wait for the initial decline. Historical data shows gold typically falls 10-30% in the first 3-6 months of a major financial crisis before beginning its recovery and eventual surge.

Core Investment Strategies
Crisis Timing Strategy
Wait for the initial 20-30% decline in gold prices during the first phase of financial crises before establishing positions.
Diversification Strategy
Combine physical gold with mining stocks, ETFs, and precious metals in different geographic markets.
Technical Analysis Strategy
Use technical indicators to identify manipulation patterns and optimal entry points during volatile periods.
Physical vs. Paper Gold Strategy
Physical Gold Advantages
- No counterparty risk during system failures
- Cannot be manipulated through paper trading
- Maintains value during currency crises
- Provides true crisis insurance
Recommendation: Allocate 60-70% of gold investments to physical gold during crisis periods.
Paper Gold Advantages
- Higher liquidity for quick trading
- Lower transaction costs
- Easier to trade during recovery phases
- No storage or insurance costs
Recommendation: Use paper gold for 30-40% of portfolio for tactical trading opportunities.
Critical Investment Warnings
Avoid Leverage: Never use leverage when investing in gold during crisis periods. The initial decline can trigger margin calls and force liquidation at the worst possible time.
Beware of ETF Risks: Some gold ETFs hold futures contracts rather than physical gold, making them vulnerable to manipulation and contango effects.
Geographic Diversification: Hold gold in multiple jurisdictions to protect against government confiscation or currency controls.
The Future of Gold as a Safe Haven

The future of gold as a safe haven asset is being reshaped by technological advances, changing monetary policies, and evolving market structures. While gold’s fundamental properties remain unchanged, the mechanisms through which it functions as a crisis asset are transforming dramatically.
Factors Strengthening Gold’s Role
Central Bank Accumulation
Central banks worldwide are dramatically increasing gold reserves, with purchases reaching record levels. This institutional demand provides strong price support during crises.
Monetary Policy Uncertainty
Unprecedented money printing and negative interest rates have increased gold’s appeal as a store of value, especially during periods of currency debasement.
Geopolitical Fragmentation
Rising tensions between major powers and the weaponization of the dollar system are driving countries to seek alternatives, benefiting gold.
Challenges to Gold’s Status
Digital Competition
Cryptocurrencies and central bank digital currencies (CBDCs) are competing for the role of crisis assets, particularly among younger investors.
Market Manipulation
Continued manipulation through derivatives and algorithmic trading may undermine investor confidence in gold’s crisis performance.
Regulatory Changes
Potential changes in gold trading regulations, taxation, or ownership rights could affect gold’s accessibility during crises.
Future Scenarios for Gold
Bullish Scenario
- • Gold reaches $5,000+ by 2030
- • Central banks continue accumulating
- • Dollar loses reserve status
- • Manipulation regulations effective
Neutral Scenario
- • Gold maintains $2,000-3,000 range
- • Competes with crypto assets
- • Periodic manipulation continues
- • Mixed central bank policies
Bearish Scenario
- • Gold falls below $1,500
- • CBDCs replace gold demand
- • Increased manipulation success
- • Government restrictions imposed
Strategic Outlook
Despite the challenges, gold is likely to maintain its role as a crisis asset, but with important caveats. Investors must understand that gold’s safe haven properties may be delayed or temporarily suppressed during the initial phases of crises due to manipulation and liquidity needs.
The key is to approach gold investment with realistic expectations, proper timing, and an understanding of the complex forces that influence its price behavior during different phases of financial crises.
Final Investment Guidance
For Crisis Protection
Maintain 5-15% portfolio allocation to physical gold. Focus on long-term holding rather than crisis timing.
For Active Trading
Use technical analysis to time entry points during crisis-induced gold declines. Expect 6-18 month recovery cycles.