Digital Transformation in Banking: Report on FinTech and Traditional Banks in 2025
Digital Transformation in Banking: Report on FinTech and Traditional Banks in 2025
The world is witnessing an unprecedented wave of digital transformation in the banking sector, where financial technology (Fintech) has become the main driver of change in an industry that has been traditional and conservative for decades. As we approach 2025, the pace of this transformation is accelerating at an unprecedented rate, driven by the development of artificial intelligence, blockchain technologies, open banking, and changing consumer behavior globally.
“Digital transformation in the banking sector is not just an option but has become an existential necessity. Banks that will succeed in 2025 are those capable of integrating technological innovation with traditional banking expertise to deliver exceptional customer experiences.”

Global FinTech Landscape in 2025
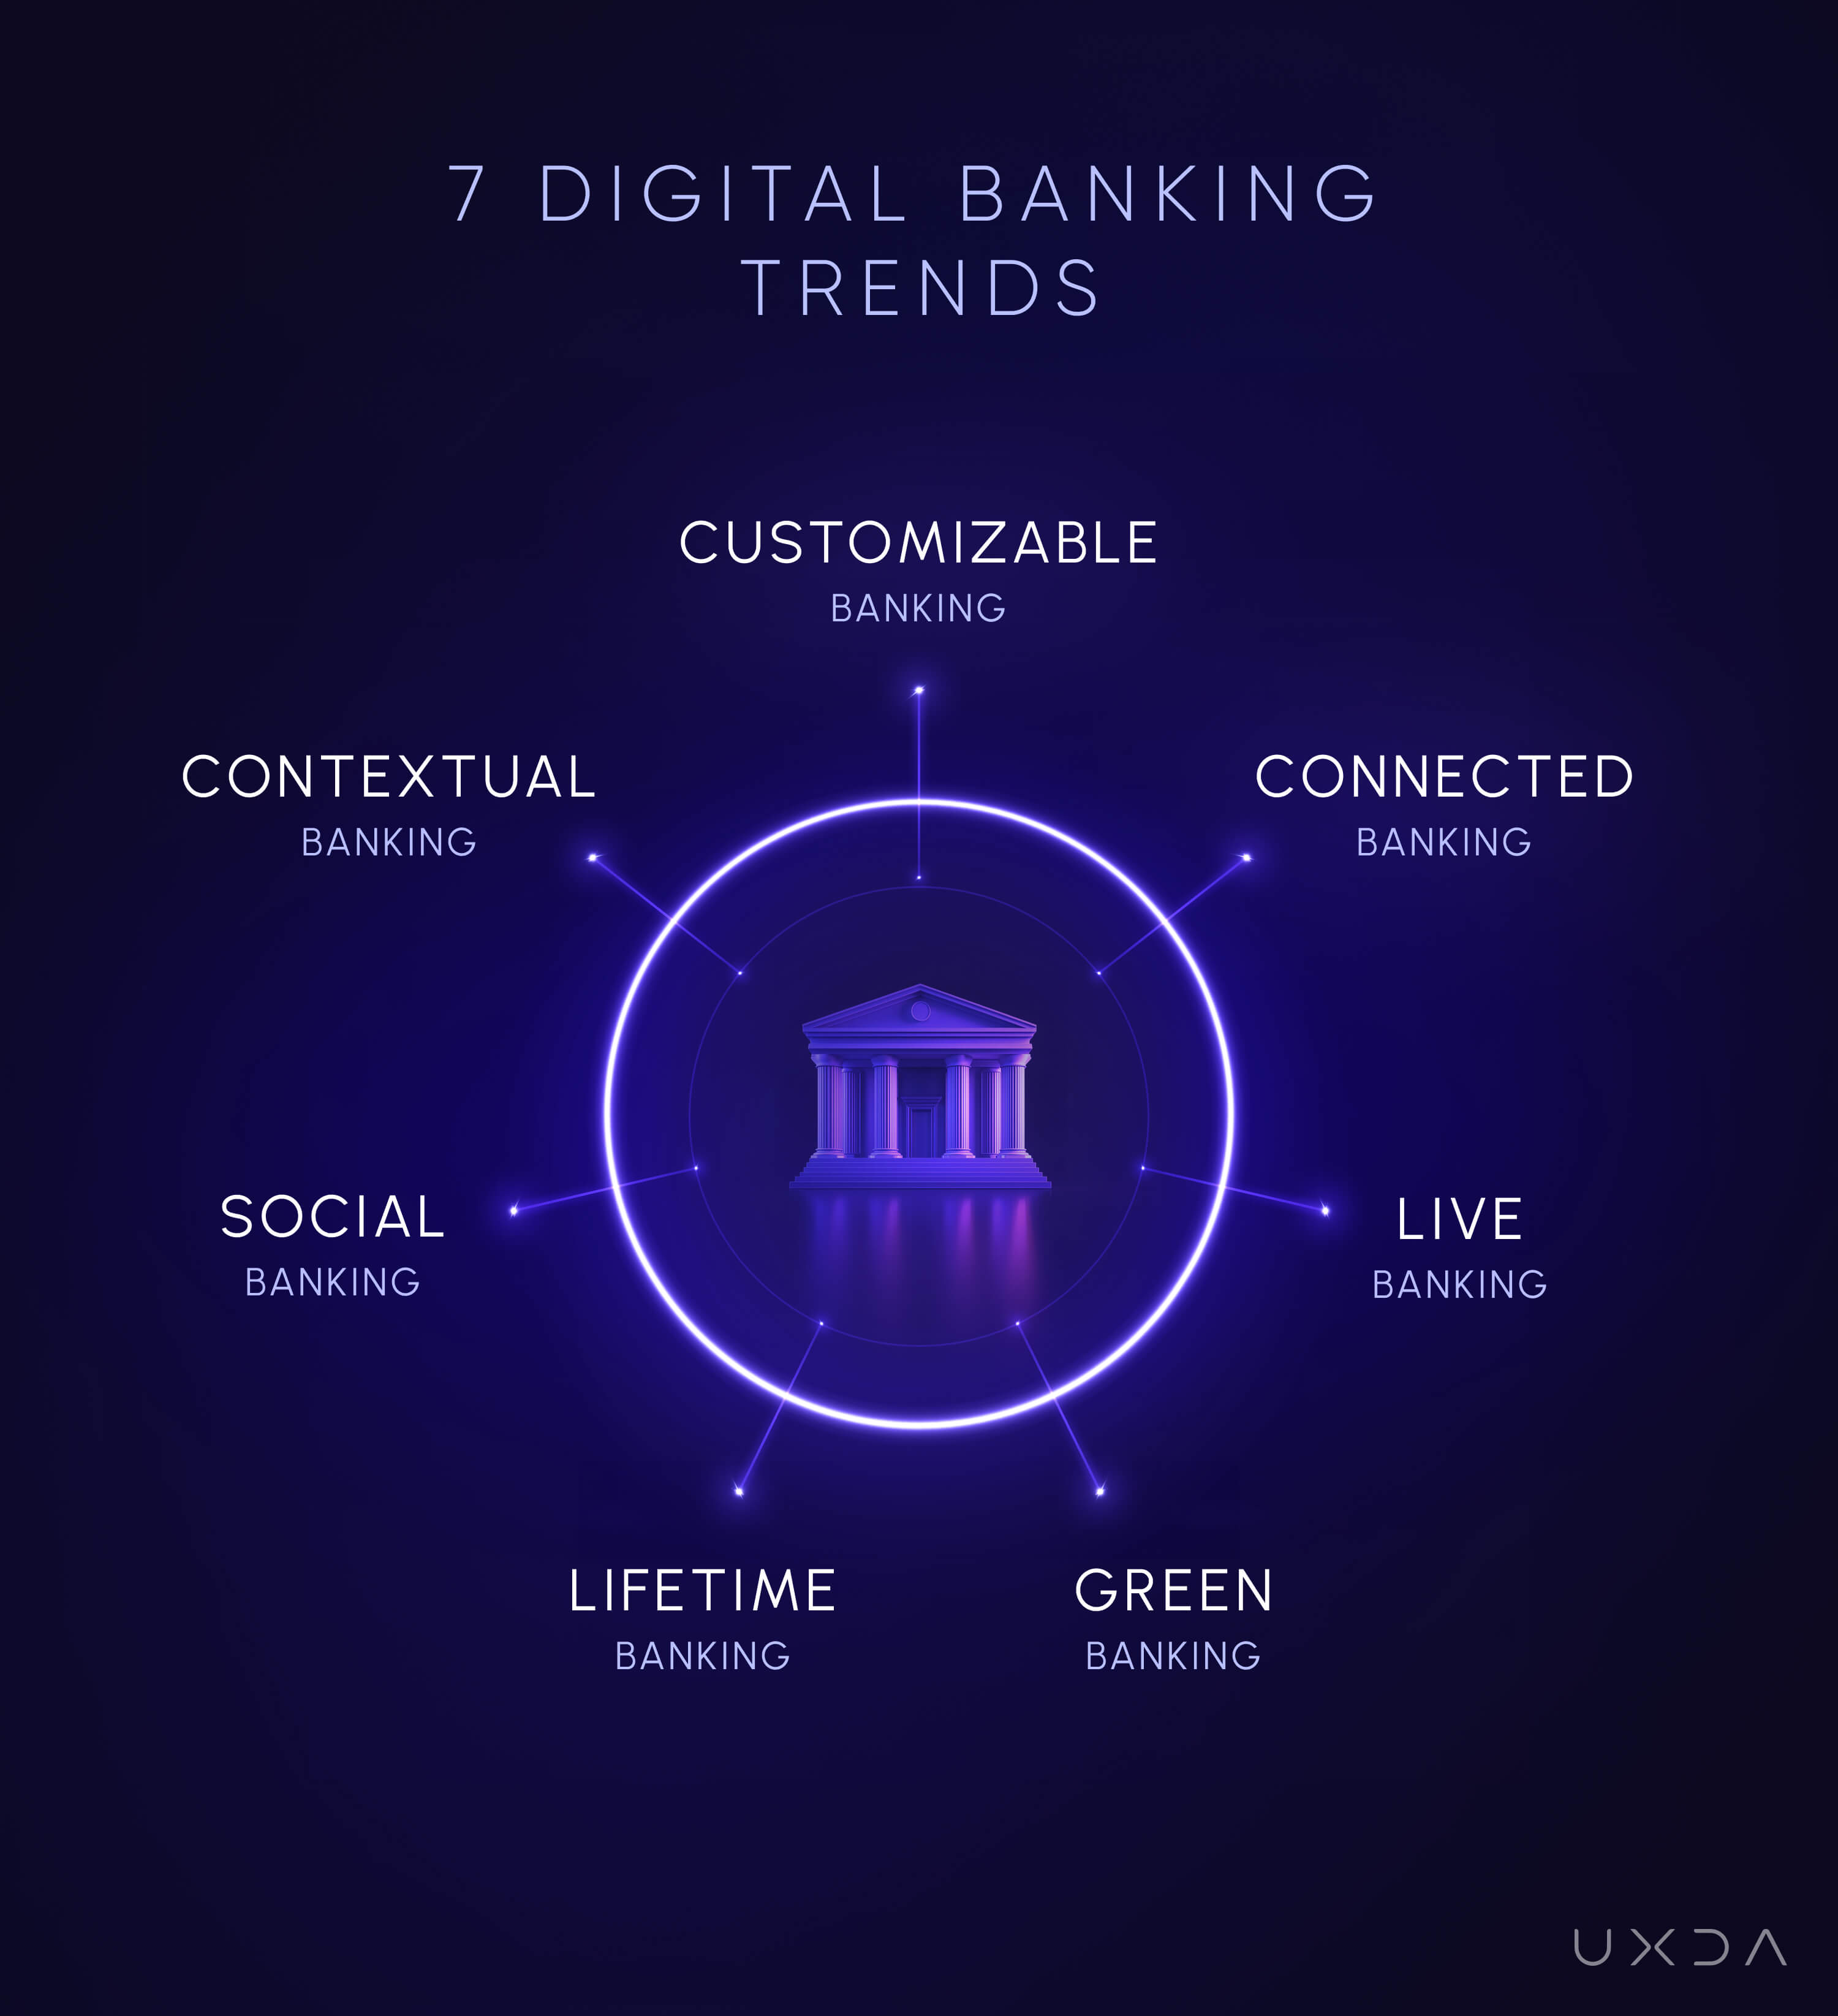
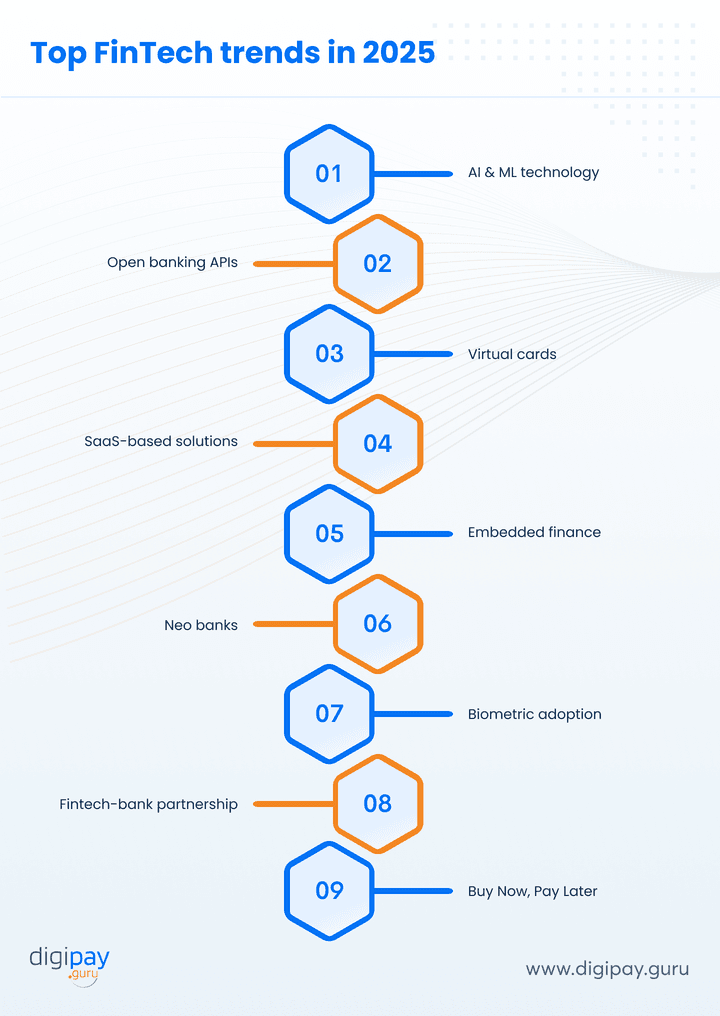
Key Global Digital Banking Trends in 2025
By 2025, the global FinTech market is expected to reach approximately $305 billion, with a compound annual growth rate exceeding 19%. This tremendous growth is driven by several interconnected factors, most importantly the radical change in customer expectations, the accelerating evolution of digital technologies, and regulatory changes that facilitate the spread of financial innovations.
Key Global FinTech Statistics for 2025
- 76% of adults worldwide use digital financial services
- 60% of global financial institutions will implement advanced AI strategies
- More than 65% of global banks will primarily adopt blockchain technologies
- Digital payments will rise to constitute 80% of total financial transactions
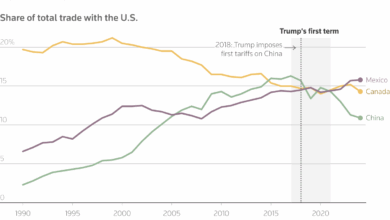
Fierce competition continues between traditional banks and emerging FinTech companies, with the emergence of a collaborative model that combines the strengths of both worlds. Asia, especially China, India, and Singapore, will lead this global transformation, thanks to their huge markets and rapid adoption of new technologies.
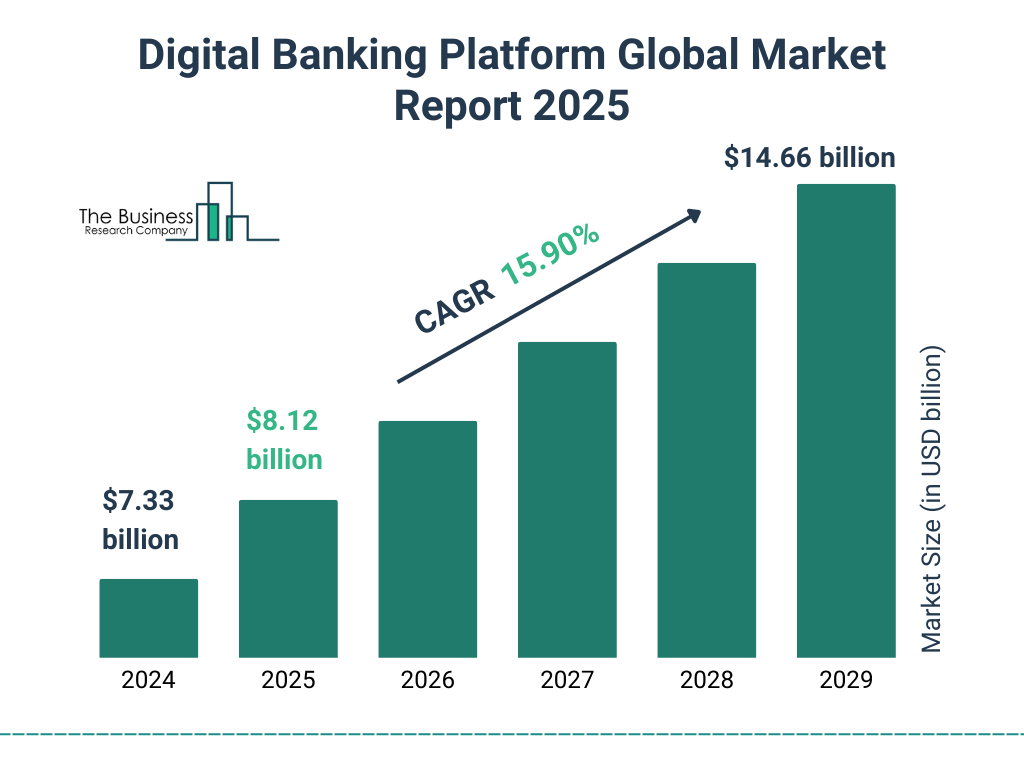
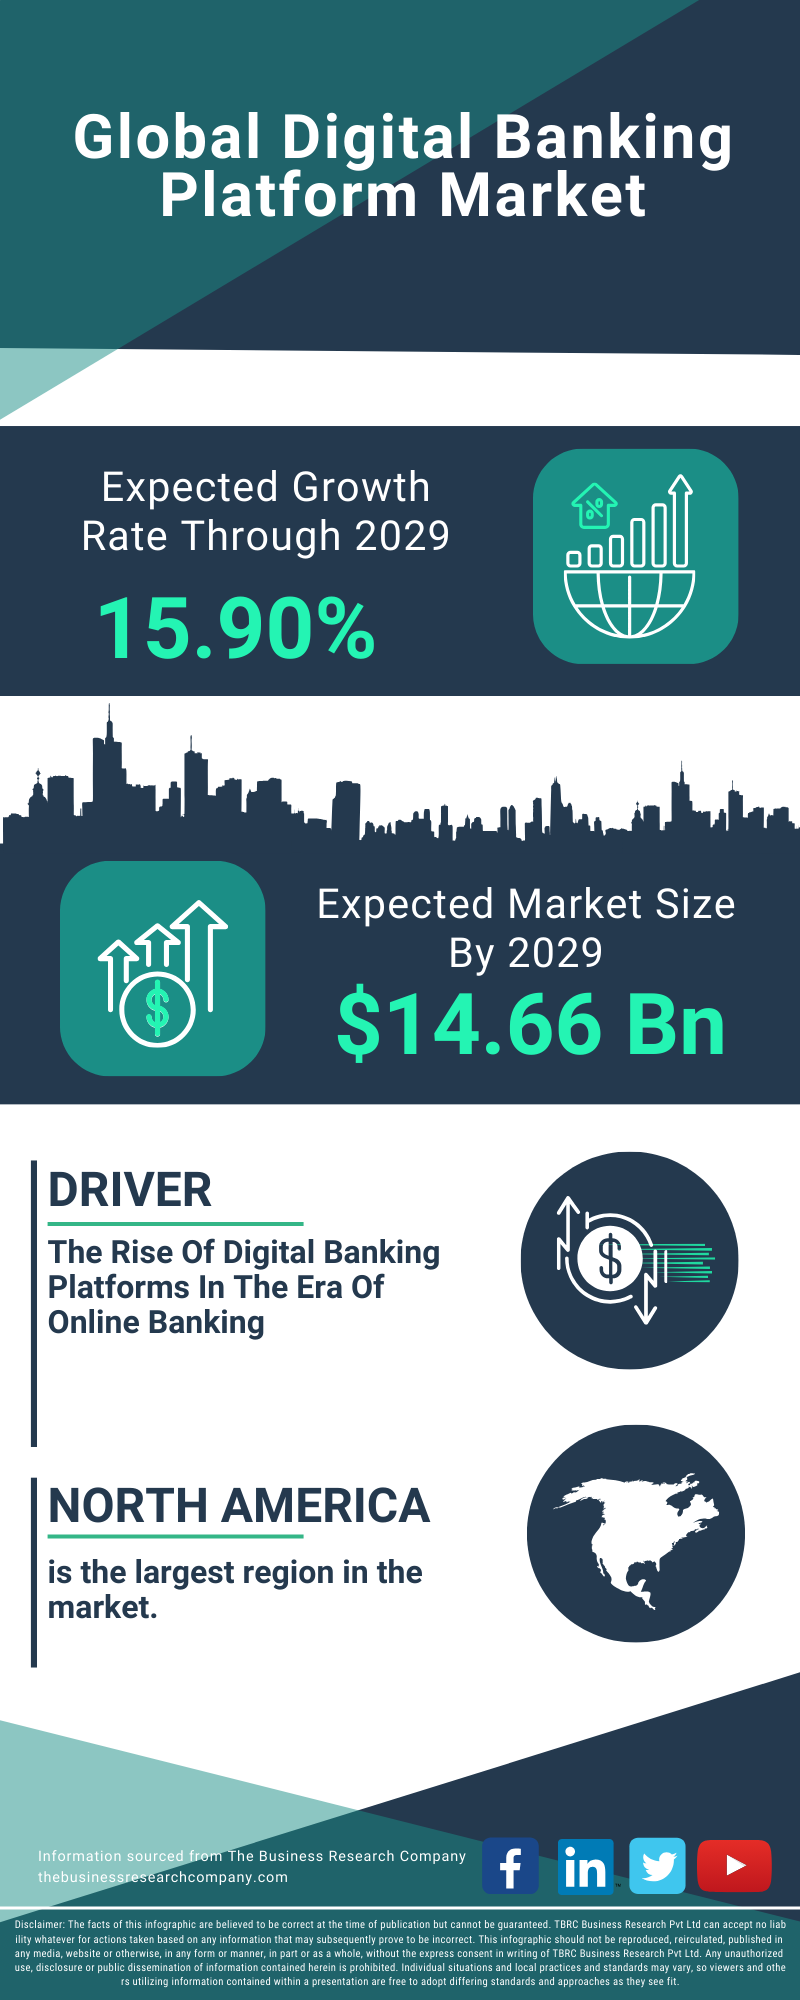
Global Digital Banking Platform Market Growth Projections Through 2025
Key Growth Drivers
- Widespread smartphone and internet adoption in emerging markets
- Increasing demand for personalized and instantaneous banking services
- Innovation-supporting regulations such as open banking
- Shift towards cashless society in many advanced economies
- Lower costs of digital financial services compared to traditional ones
Key Challenges and Risks
- Increasing cyber threats and digital financial fraud
- Privacy concerns and protection of personal financial data
- Digital divide and financial inclusion challenges in less developed regions
- Difficulties adapting to constantly changing regulatory environments
- Increasing competition from big tech companies (BigTech)
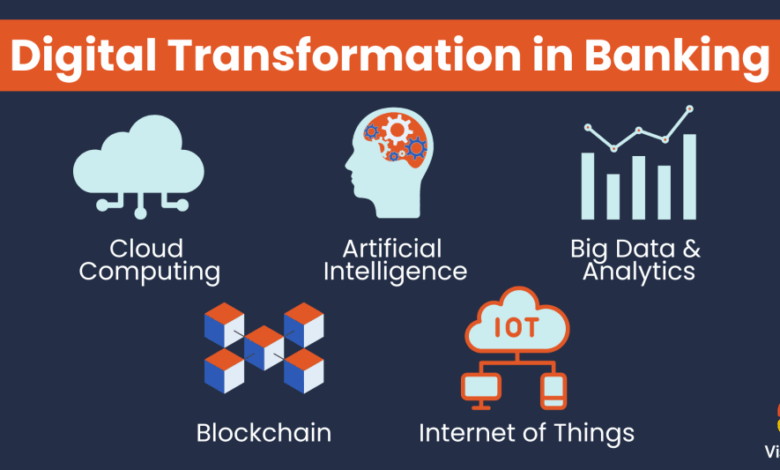
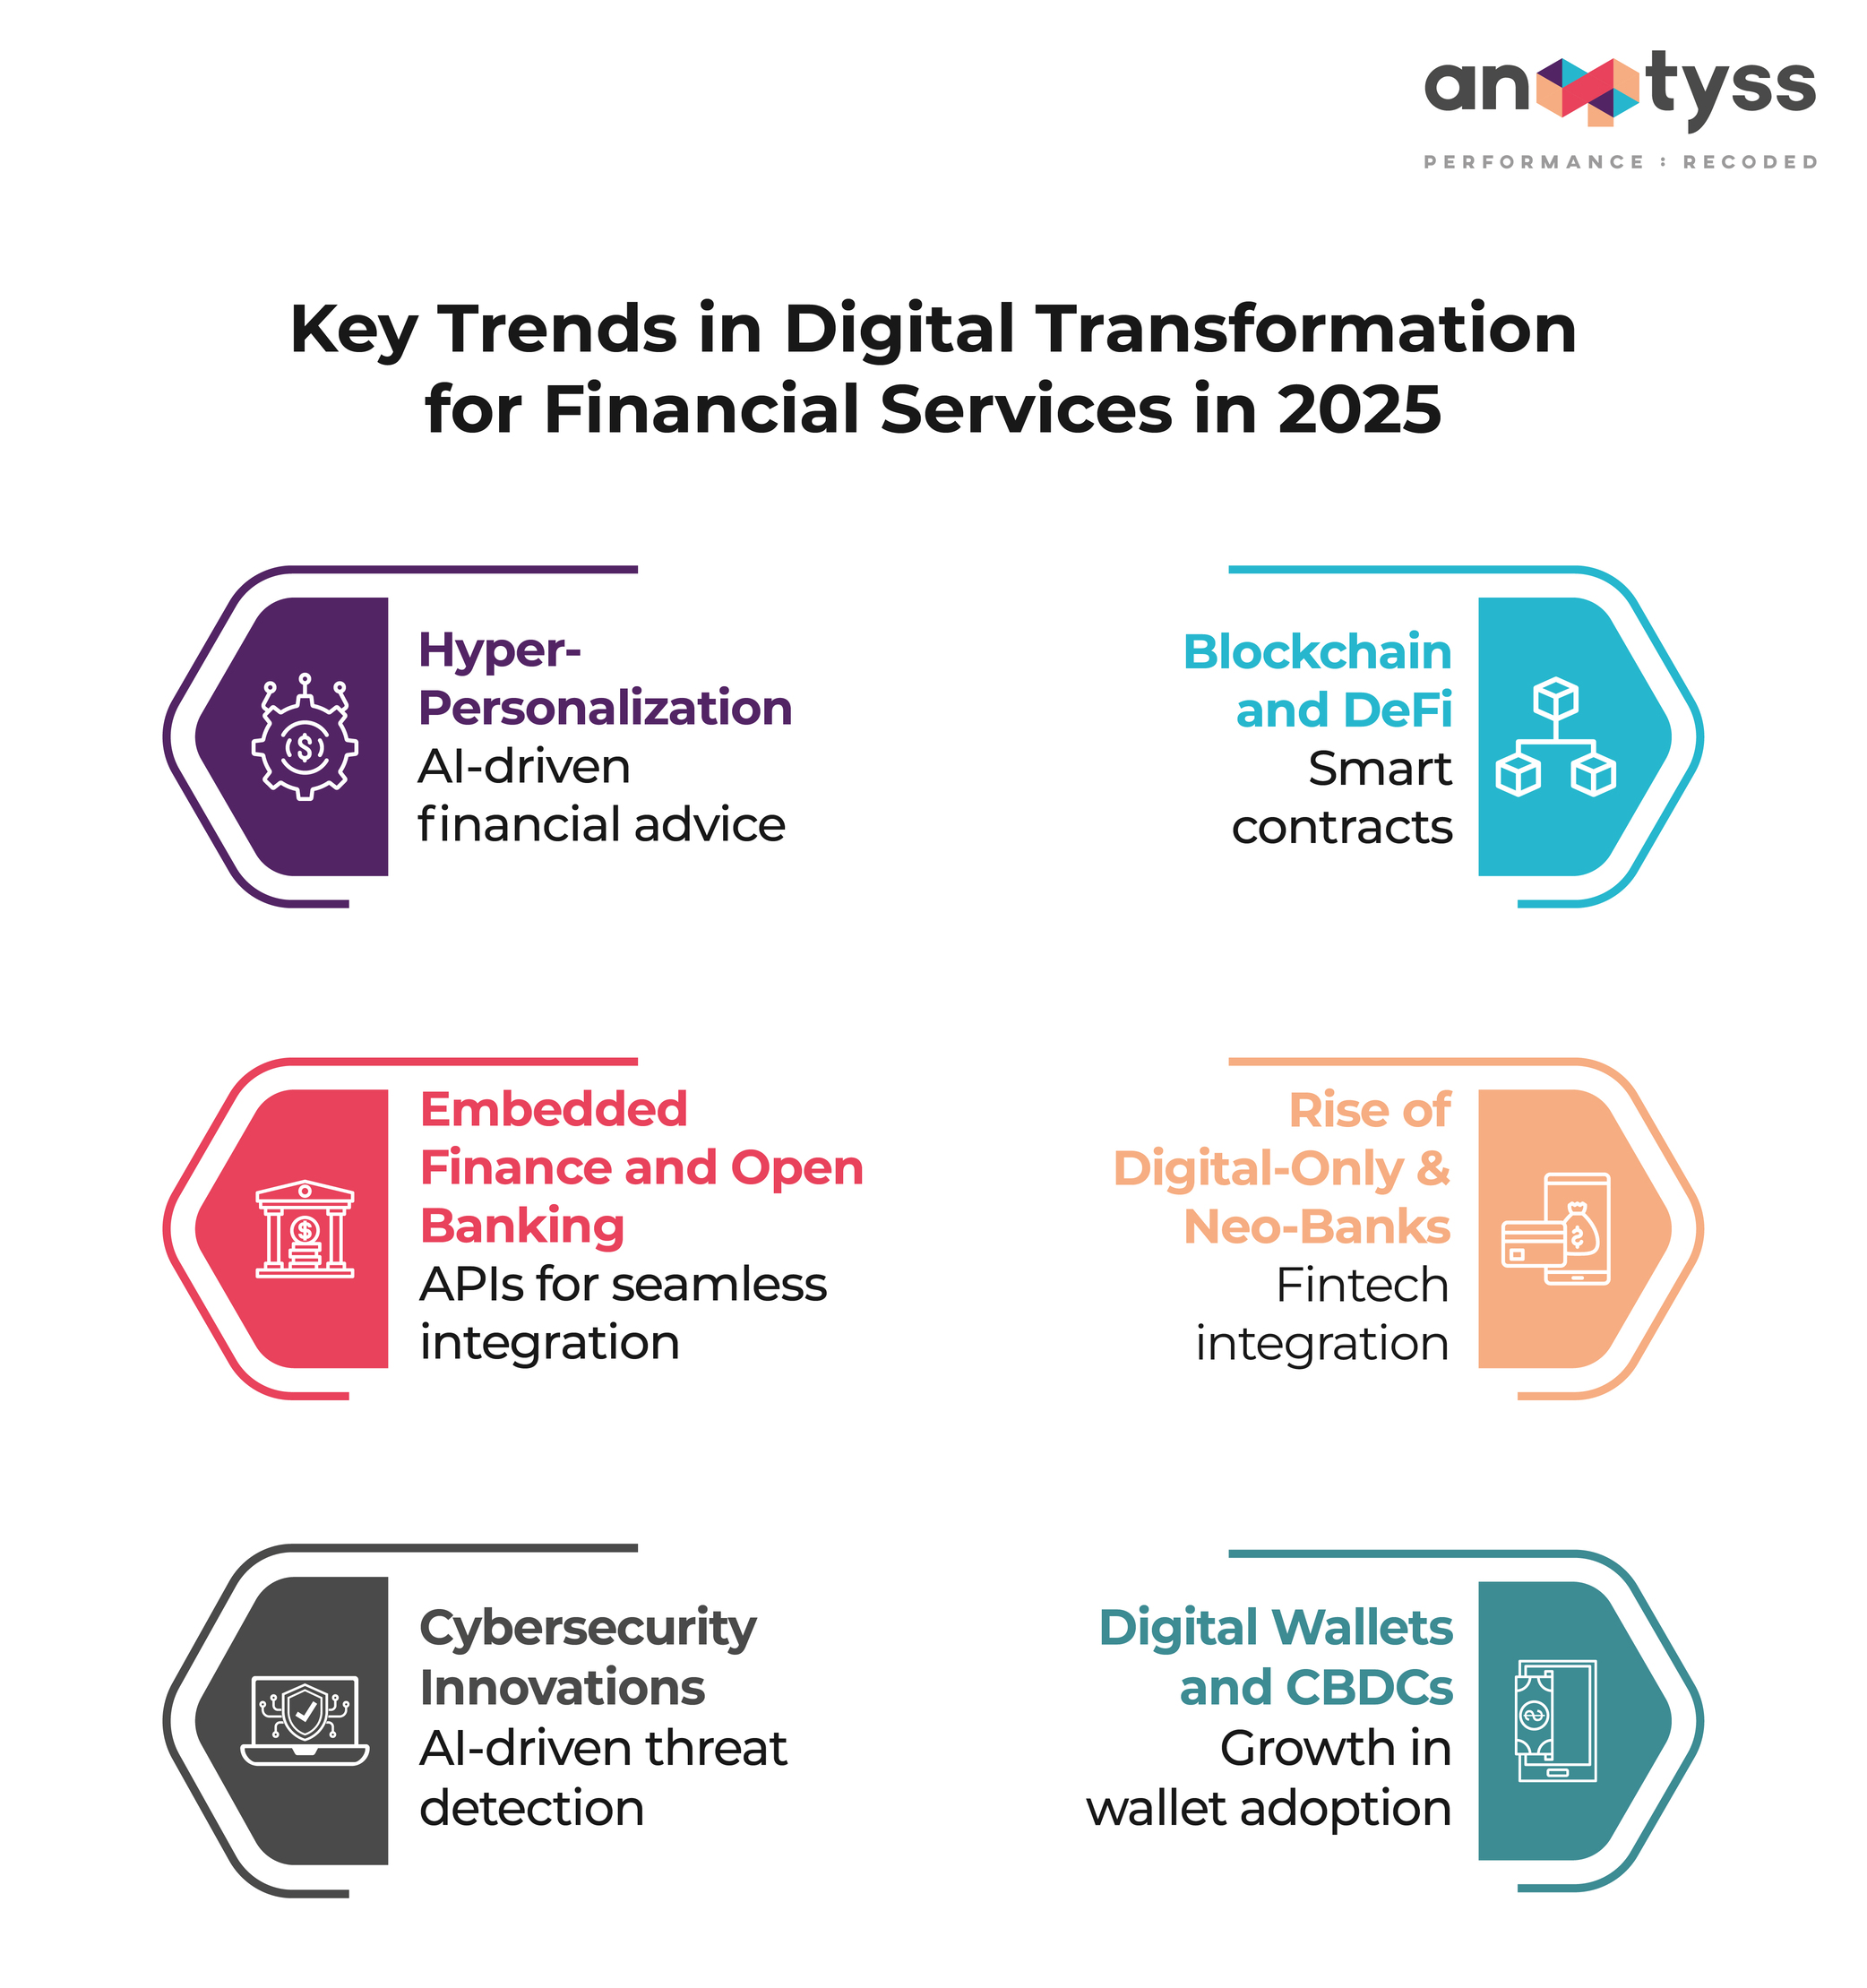
Pivotal Technologies Shaping the Future of Global Banking

Key Technologies Influencing Digital Transformation in Global Banking
A set of advanced technologies plays a pivotal role in reshaping the global banking sector, working to improve customer experience, increase operational efficiency, enhance security, and expand the range of available financial services.
“By 2025, more than 80% of global financial institutions will rely on artificial intelligence and machine learning to improve services, detect fraud, automate operations, and deliver personalized financial experiences to customers.”
Artificial Intelligence and Machine Learning
2025 will witness advanced applications of artificial intelligence in all aspects of banking, from virtual financial advisors (Robo-Advisors) to advanced risk analysis systems and real-time fraud detection.
Blockchain Technologies and Digital Currencies
Blockchain technologies will transition from the experimental stage to widespread practical application in 2025, focusing on cross-border payment settlement, trade finance, and smart contracts. More than 80% of major global central banks will also launch their own digital currencies.
Open Banking
By 2025, open banking will be widespread globally, enabling secure sharing of financial data between various institutions through application programming interfaces (APIs), enhancing competition and supporting the innovation of new financial products.
Fully Digital Banks (Neobanks)
Fully digital banks will capture an increasing market share in 2025, benefiting from their low-cost operational structures and ability to deliver superior user experiences. The number of customers for these banks will reach more than 400 million globally.
Cybersecurity and Advanced Verification Technologies
With increasing electronic threats, 2025 will witness widespread adoption of advanced security technologies such as biometric multi-factor authentication, behavioral verification, and AI-based fraud detection technologies.
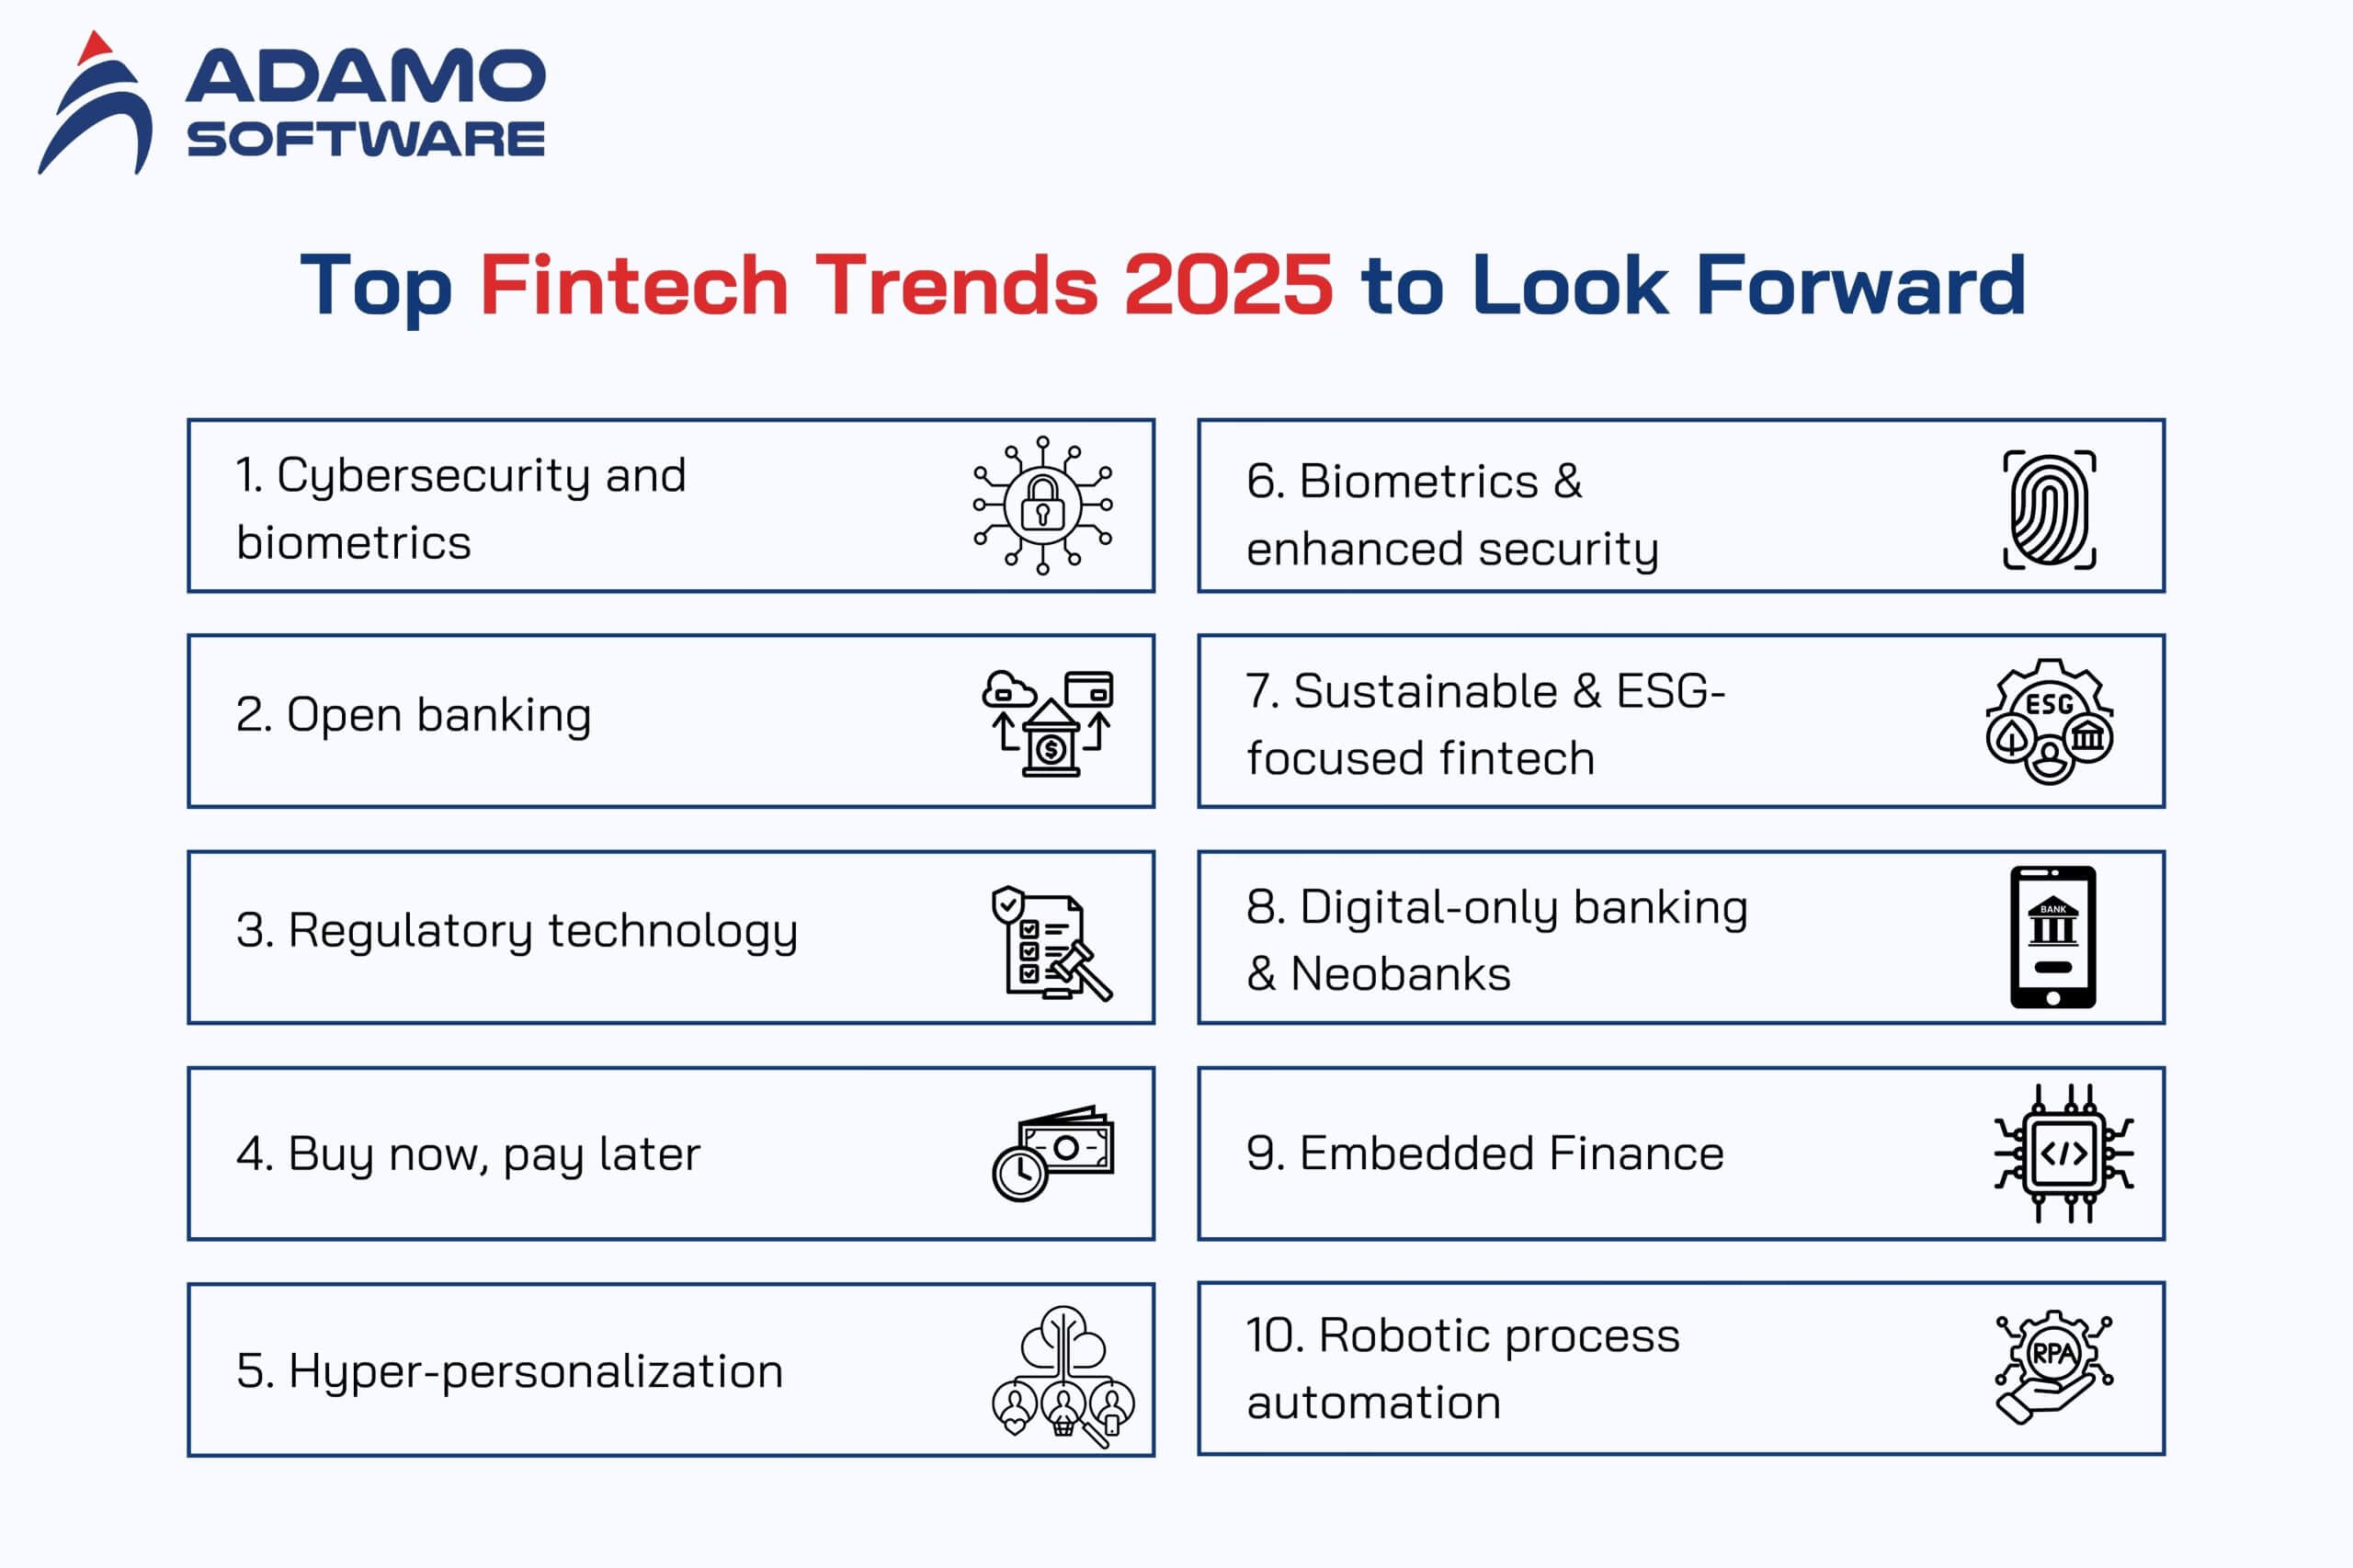
Emerging Trends in 2025
Embedded Finance
2025 will witness widespread adoption of the embedded finance model, where financial services are directly integrated into e-commerce platforms, smartphone applications, and others, allowing consumers to access financial services without needing to visit banking applications.
Decentralized Finance (DeFi)
Decentralized finance technologies will begin to integrate with the traditional financial system, with the emergence of hybrid products that combine the advantages of both worlds. Traditional banks will adopt some DeFi principles to improve their operational efficiency and reduce costs.
Banking Services in the Metaverse
By 2025, leading banks will begin to offer financial services within metaverse worlds, such as virtual branches, interactive financial consultations, and immersive financial training. New digital assets linked to these virtual worlds will also emerge.
Sustainable and Green Finance
The coming years will see increasing interest in sustainable and green finance, with the development of digital tools to track the carbon footprint of financial transactions, issuance of digital green bonds, and systems for evaluating investments from a sustainability perspective.
Transformation of Traditional Banks in the Face of the Digital Era

Traditional banks are adopting various strategies for digital transformation
Global traditional banks face unprecedented challenges with the accelerating pace of digital transformation and the emergence of new competitors. These institutions have adopted various strategies to adapt to this changing landscape, ranging from comprehensive digital transformation to creating separate digital units and partnering with FinTech companies.
Facts About Global Traditional Banks Transformation
- Investment of more than $500 billion in digital transformation by 2025
- Reduction of physical branches by 30-40% in advanced markets
- Decrease in traditional workforce with increased hiring in technical fields
- Creation or acquisition of more than 250 digital banks by traditional banks
Comprehensive Transformation Model
Many major global banks are adopting a comprehensive digital transformation strategy, where they completely redesign their operations, update their core systems, and enhance their analytical capabilities. This strategy is characterized by comprehensiveness and depth, but requires huge investments and radical cultural changes.
Separate Digital Bank Model
Some banks prefer to create separate digital banks that operate independently from traditional operations. This model allows freedom of innovation without the constraints of legacy systems, while benefiting from the customer base and banking expertise of the parent institution.
Partnership and Acquisition Model
Other banks are moving towards partnering with FinTech companies or acquiring them, to benefit from their innovative capabilities and advanced technologies. This strategy enables accelerating digital transformation and avoiding the challenges of internal development.
Digital Transformation Challenges for Traditional Banks
Technical Challenges
- Legacy core banking systems
- Integration of new technologies with existing infrastructure
- Updating data management and analytics systems
- Building a secure cloud infrastructure compliant with regulatory requirements
Cultural and Organizational Challenges
- Resistance to change within traditional institutions
- Lack of digital and technical skills in the workforce
- Need for restructuring departments and operations
- Challenges in adopting a culture of innovation and rapid experimentation
Digital Transformation Success Strategies
- Adopting a customer-centric approach in all transformation initiatives
- Implementing Agile and DevOps methodologies in banking product development
- Investing in developing digital skills for employees and attracting technical talent
- Updating core systems gradually and thoughtfully
- Developing data analytics capabilities to enhance decision-making
Key Success Indicators
- Reduction in customer service costs by 30-50%
- Increase in new customer acquisition rates through digital channels
- Improvement in customer satisfaction and NPS score
- Reduction in time-to-market for new products
- Improvement in operational efficiency ratio (Cost-to-Income Ratio)
FinTech Startups: Drivers of Innovation in the Banking Sector
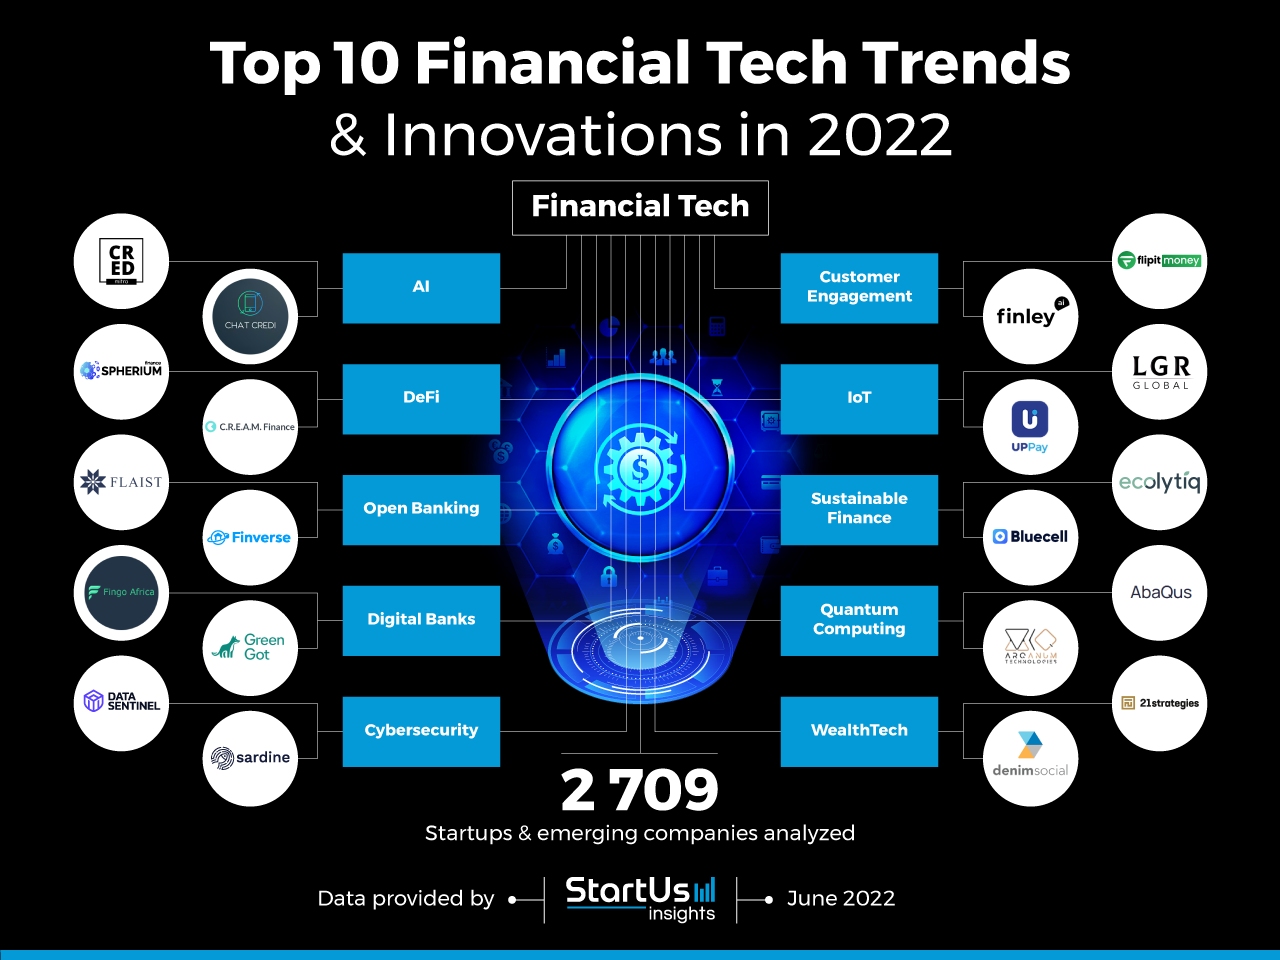
FinTech Innovation Map and Specialized Areas
FinTech startups continue their role as key drivers of innovation in the global banking sector, with investment in these companies expected to reach record levels by 2025. These companies are characterized by their high flexibility and ability to develop innovative financial solutions that meet the needs of specific market segments.
“Successful FinTech companies in 2025 will be those capable of building integrated ecosystems, expanding globally, achieving balance between innovation and regulatory compliance, and developing sustainable revenue sources.”

Global FinTech Sector Growth Forecasts Through 2025
Payments and International Transfers
The payments sector continues to lead the FinTech landscape, focusing on developing low-cost, high-speed cross-border payment solutions, contactless payments, and peer-to-peer (P2P) payments.
Digital Lending and Alternative Finance
The digital lending sector is experiencing accelerated growth, with the emergence of new models such as crowdfunding, peer-to-peer lending, and point-of-sale embedded financing. These platforms use advanced algorithms to assess risks and speed up loan approval processes.
Banking as a Service (BaaS)
The Banking as a Service model is growing in importance, where specialized platforms provide application programming interfaces (APIs) that allow companies to integrate financial services into their products without needing to obtain full banking licenses.
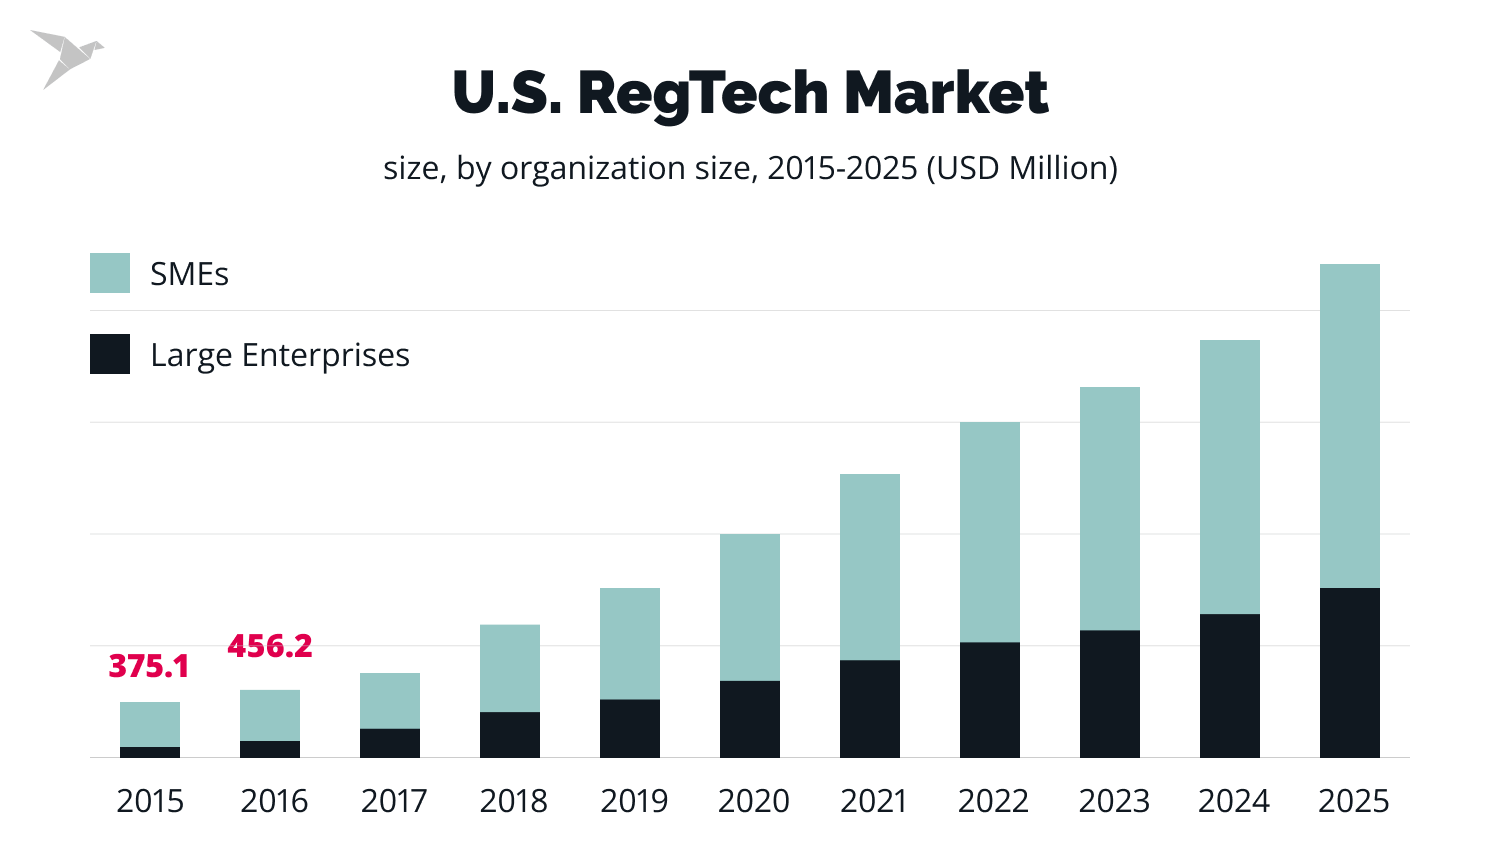
Regulatory Technology (RegTech)
With increasing regulatory complexities, companies specializing in providing technical solutions for regulatory compliance are emerging, such as anti-money laundering systems, electronic customer identification, and automated regulatory reporting.
Insurance Technology (InsurTech)
Insurance technology companies are experiencing accelerated growth, offering innovative solutions including instant insurance, usage-based insurance, customized pricing models, and automated claims, using artificial intelligence and the Internet of Things.
Emerging FinTech Models in 2025

AI-Powered FinTech
FinTech companies will increasingly rely on advanced artificial intelligence, especially deep learning techniques and neural networks, to provide highly personalized financial services and operational efficiency.
Applications include AI-powered robo-advisors, automated wealth management systems, and credit risk analysis solutions based on behavioral data.
Embedded Finance Platforms
2025 will see significant expansion in embedded finance, where financial services are seamlessly integrated into non-financial applications and platforms, allowing consumers to access financial services without leaving the primary application.
Examples include payments embedded in transportation apps, insurance services integrated into travel booking platforms, and instant loans at digital points of sale.
Global Regulatory Environment for Digital Financial Services in 2025
The regulatory environment for digital financial services is continuously evolving to keep pace with rapid innovations in financial technology. By 2025, global regulatory frameworks will be more mature and integrated, focusing on achieving a balance between encouraging innovation and protecting consumers and the financial system.
Key Regulatory Trends
- Evolution of open banking frameworks at the global level
- Enhancement of data protection and consumer privacy rules
- Regulation of crypto assets and central bank digital currencies
- Development of regulatory frameworks for new technologies such as AI and blockchain
- Increasing international cooperation in combating digital financial crimes
The evolving regulatory environment for global FinTech
“Successful regulatory bodies in 2025 will be those capable of adopting a flexible, principles-based approach that allows for innovation while ensuring financial stability and consumer protection.”
Regulatory Sandboxes
Regulatory sandboxes will become globally widespread, with the development of “cross-border sandbox” models that allow companies to test financial innovations in multiple markets simultaneously, facilitating global expansion for startups.
Supervisory Technology (SupTech)
Regulatory bodies will increasingly adopt supervisory technology solutions, using artificial intelligence and big data analytics to enhance their supervisory capabilities, monitor risks in real-time, and predict future trends.
Unified Digital Assets Regulation
2025 will see the development of integrated regulatory frameworks for digital assets and cryptocurrencies, covering various aspects such as asset issuance, trading, custody, anti-money laundering, and taxation, with greater international coordination.
Regulatory Challenges and Opportunities
Future Regulatory Challenges
- Balancing innovation with financial stability and consumer protection
- Keeping pace with accelerating technological development
- Developing technical expertise within regulatory bodies
- Coordination across sectors and national boundaries
- Addressing emerging risks from technologies such as artificial intelligence
Future Regulatory Opportunities
- Enhancing financial inclusion through supporting innovative financial solutions
- Improving efficiency and transparency of the global financial system
- Reducing compliance costs through regulatory technology
- Strengthening international cooperation in FinTech regulation
- Building regulatory frameworks for emerging risk sources
The Future of Global Digital Financial Inclusion

FinTech enhances global financial inclusion
Digital financial inclusion represents one of the most important benefits of digital transformation in the banking sector. By 2025, FinTech is expected to help reduce the number of financially excluded people globally from 1.7 billion to less than 1 billion by providing accessible and low-cost financial services.
“FinTech is not just a means to achieve efficiency and profitability, but a powerful tool for achieving sustainable development and financial inclusion at the global level.”
Digital wallets, mobile payments, micro banking services, and digital identities play a pivotal role in expanding access to financial services in remote areas and marginalized groups around the world.
Digital Financial Services for Marginalized Groups
Companies and financial institutions are developing services specifically designed for groups marginalized from traditional financial services, such as rural communities, women, youth, micro-enterprises, and migrants. These services are characterized by ease of use, low costs, and suitability for the special needs of these groups.
Bridging the Digital Divide
Despite significant progress in digital financial inclusion, the digital divide remains a major challenge. Addressing this gap requires investments in communications infrastructure, promotion of digital financial literacy, and development of simple, multilingual user interfaces suitable for different levels of technology literacy.
Global FinTech trends in 2025 and their role in enhancing financial inclusion
Innovative Platforms for Digital Financial Inclusion
Financial Digital Identities
Digital identity systems play a pivotal role in expanding financial inclusion by simplifying Know Your Customer (KYC) processes and enabling individuals without traditional official documents to access financial services.
By 2025, many countries will adopt national digital identity frameworks integrated with financial systems, with increasing use of biometrics and decentralized technology to ensure security and privacy.
Community Digital Banks
New models of community digital banks are emerging that serve specific communities or marginalized groups, focusing on the special needs of these groups and building sustainable business models that serve low-income markets.
These banks integrate advanced technology with traditional community models such as savings associations and rotating credit and loans, with a strong focus on financial education and economic empowerment.
Inclusive Digital Payments
Digital payment systems are experiencing accelerated development to become more inclusive, by reducing transaction costs, simplifying user interfaces, and supporting transactions in areas with limited internet connectivity.
Mobile payment platforms play a central role in this transformation, especially in Africa and Asia, with expansion in services to include savings, credit, and micro-insurance.
Digital Sustainable Finance
There is increasing interest in integrating environmental and social sustainability into digital financial services, through micro green finance platforms, digital impact investing, and tools to track the carbon footprint of financial transactions.
These platforms target financing small clean energy projects, sustainable agriculture, and emerging social businesses in low-income communities.
Conclusion: The Future of Banking in the Digital Transformation Era
The global banking sector stands on the threshold of a radical transformation, driven by accelerating technological developments and changing customer expectations. By 2025, we will witness a more integrated, open, and inclusive banking landscape, where traditional boundaries between financial institutions and technology companies fade away.
Traditional banks will adopt various strategies to adapt to this new landscape, from comprehensive digital transformation to partnerships with FinTech companies. Meanwhile, emerging FinTech companies will continue their role as drivers of innovation, with an increasing trend towards building integrated ecosystems and expanding the scope of their services.
“The future of the banking sector will not be a struggle between traditional banks and FinTech companies, but will be based on cooperation and integration to provide better financial experiences for customers. The institutions that will succeed are those able to combine the power of advanced technology, deep banking expertise, and understanding of changing customer needs.”
With all the exciting technological developments, humans remain the focus of digital transformation in the banking sector. The ultimate goal is to enable individuals and companies to manage their money more efficiently, securely, and easily, and to expand access to financial services to include billions of people currently deprived of them. The future of the banking sector will not be determined only by technology, but also by its ability to serve human needs and achieve sustainable and inclusive development.
Key Banking Sector Trends in 2025
- Greater integration between traditional and digital financial worlds
- Extreme personalization of financial services through artificial intelligence
- Shift in competition from products to customer experience and data
- Rise of integrated financial ecosystems
- Mainstreaming of central bank digital currencies
- Expansion of digital financial inclusion globally
- Development of more mature and flexible regulatory frameworks
Strategic Recommendations for Financial Institutions
For Traditional Banks
- Accelerate the pace of comprehensive digital transformation
- Develop an organizational culture that supports rapid innovation
- Invest in modernizing core systems
- Adopt collaborative models with FinTech companies
- Focus on multi-channel customer experience
For FinTech Companies
- Build sustainable, long-term business models
- Focus on global expansion while considering local specificities
- Invest in cybersecurity and regulatory compliance
- Build strategic alliances with traditional institutions
- Pay attention to community role and enhance financial inclusion
For Regulatory Bodies
- Develop balanced regulatory frameworks that encourage innovation while protecting consumers
- Adopt a risk-based and principles-based regulatory approach
- Enhance international cooperation in FinTech regulation
- Invest in technical and analytical capabilities
- Develop frameworks for regulating emerging technologies such as AI and decentralized finance