Comprehensive Analysis: How Stablecoins Are Transforming the Global Financial Landscape in 2025
Comprehensive Analysis: How Stablecoins Are Transforming the Global Financial Landscape in 2025
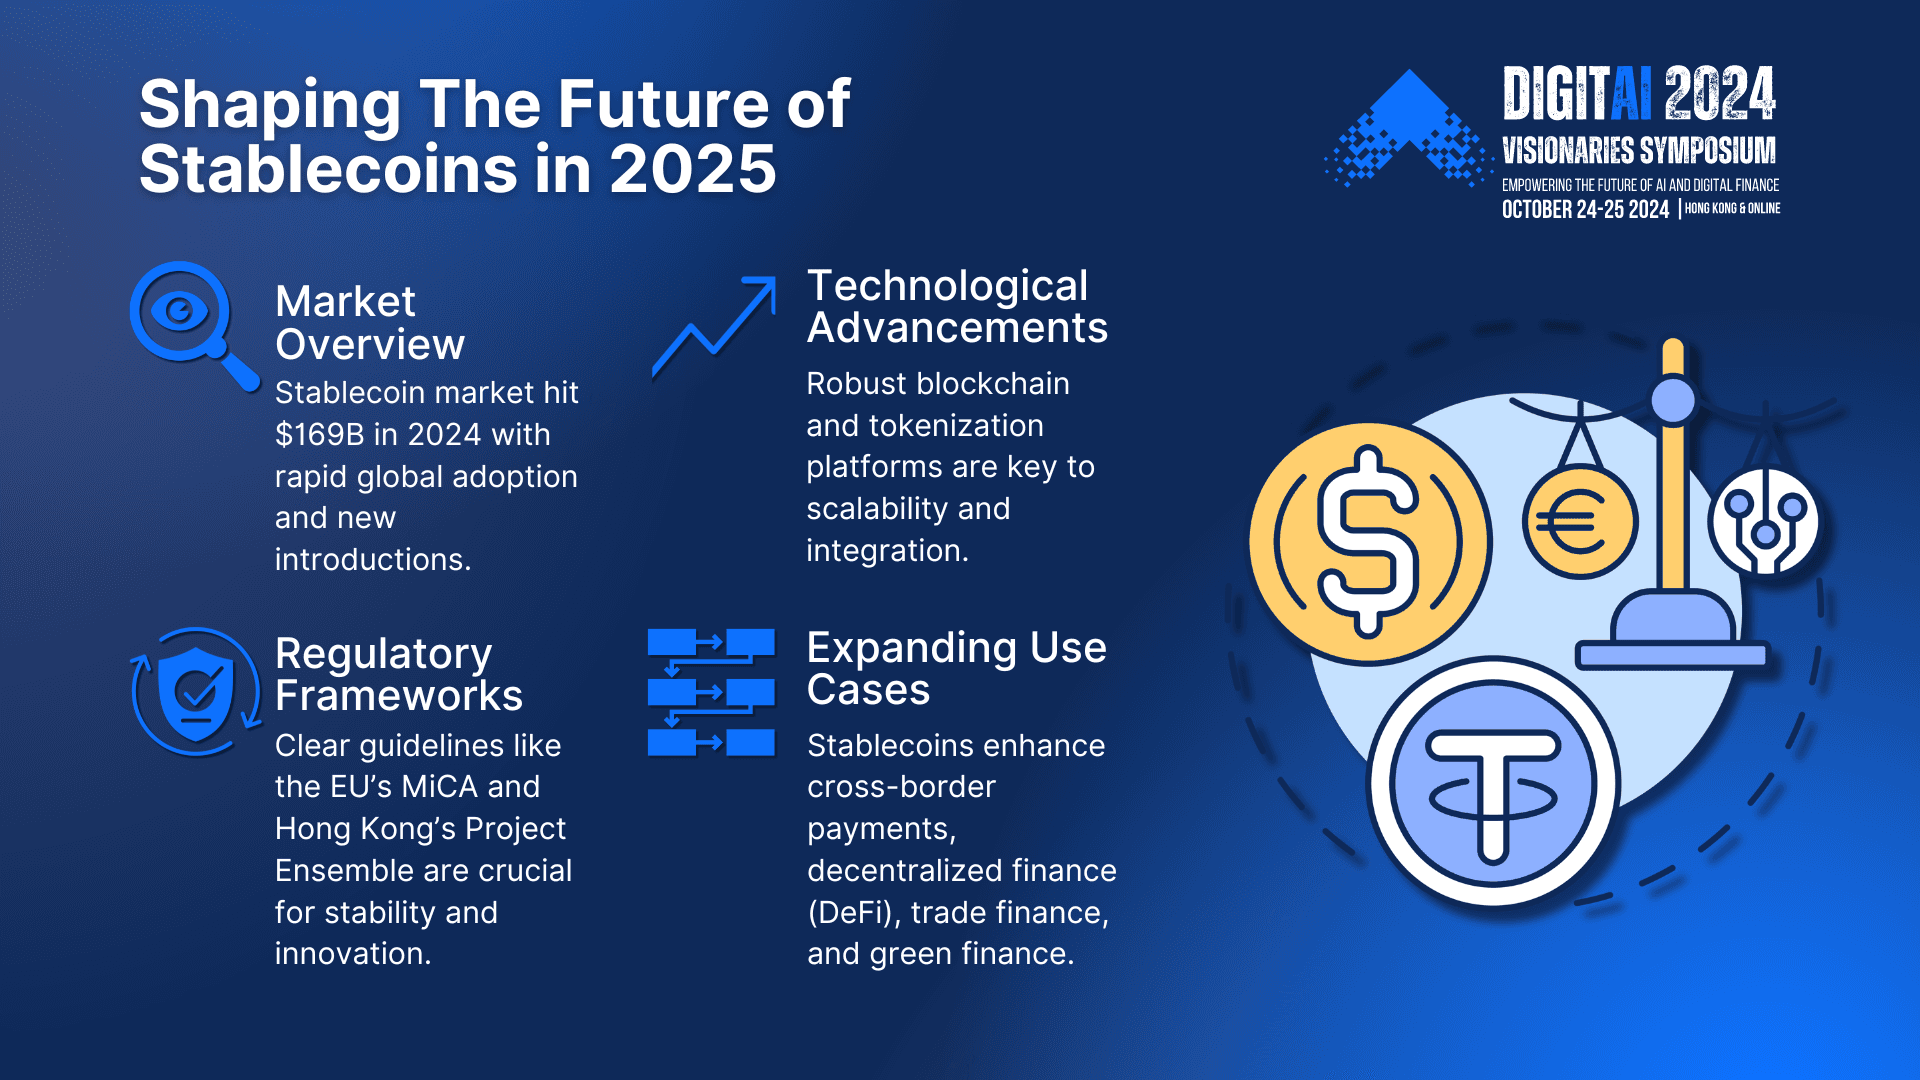
The year 2025 is witnessing a radical transformation in the global financial landscape, with stablecoins reaching a critical turning point in their adoption and spread. After years of gradual development, these digital assets have evolved from merely marginal tools in the cryptocurrency world to become fundamental drivers of change in the global financial system, thanks to their increasing adoption by major corporations, traditional financial institutions, and governments across the world.
“2025 represents a turning point for stablecoins, as they transition from early adoption to comprehensive use in global payments, carrying with them the promise of a more efficient, inclusive, and scalable financial system.” – Thunes Global Payments Report, 2025
Accelerated Growth: Exceeding $220 Billion
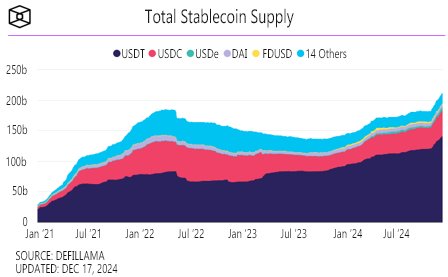
Growth of the USD-pegged stablecoin market during 2020-2025
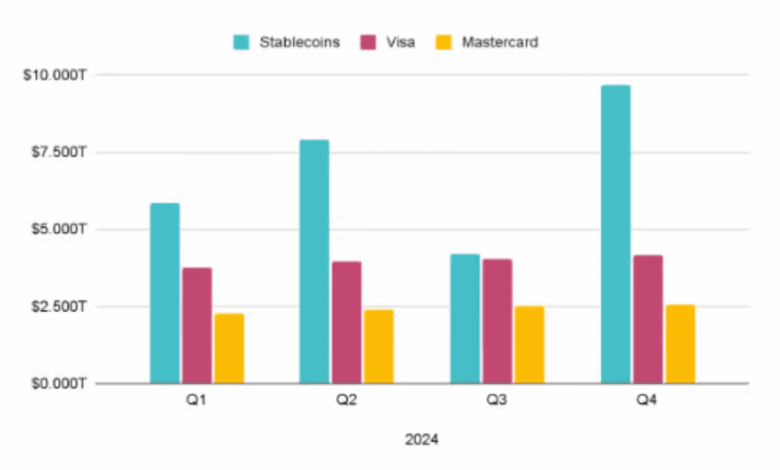
According to the latest data from Outlier Ventures in the first quarter of 2025, the market capitalization of USD-pegged stablecoins has exceeded $220 billion, representing 99.8% of all fiat-pegged stablecoins. This growth reflects a compound annual growth rate of 28% since 2023, indicating a significant acceleration in adoption.
Impressive Figures in the Stablecoin Market
- Market Capitalization: Exceeded $220 billion in Q1 2025
- Number of Active Users: Increased from 19.6 million in February 2024 to more than 30 million in February 2025 (53% growth)
- Daily Trading Volume: Exceeded $50 billion, making stablecoins one of the most liquid assets in the world
- Reserves: Increasingly backed by US Treasury bills and short-term government bonds
This accelerated growth is a direct result of the expansion in stablecoin use cases beyond their traditional scope in cryptocurrency markets. They are increasingly being used in cross-border payments, e-commerce, corporate treasury management, as well as entering new sectors such as embedded finance and financial services for the unbanked.

Market share distribution among major stablecoins in Q1 2025
Growth Drivers
- Lower cross-border transaction costs compared to traditional methods (less than 1% versus 3-7% for traditional transfers)
- Near-instant settlement (24/7) compared to days for international bank transfers
- Regulatory clarity in key markets, especially after the enactment of the GENIUS Act in the United States
- Improved stablecoin infrastructure through networks like Ethereum Layer 2 and LayerZero
- Adoption by traditional financial institutions of stablecoin-based payment solutions
Market Distribution and Competition
- Tether (USDT): Still holds the largest share at 53% of the market
- USD Coin (USDC): Captures 24% of the market, with strong growth in the institutional sector
- USDe (Ethena): The new competitor that has captured 8% of the market in one year
- DAI: Market share stabilized at 6% while primarily targeting the DeFi sector
- Next-generation stablecoins: PYUSD, SGDC, and EURe are gaining momentum
Corporate Adoption: The “Magnificent 7” Lead the Way

Stablecoin applications in corporate treasury departments, Source: EY 2025
2025 has witnessed a radical shift in the stance of major global corporations towards stablecoins, as these tools have moved beyond the experimentation phase to actual implementation in daily operations. In an exciting development, five companies from the “Magnificent 7” (the largest American technology companies) announced their acceptance of stablecoins as a payment method, marking a significant milestone in the adoption journey of these currencies.
“When companies like Apple, Microsoft, and Amazon adopt stablecoins in their financial operations, this not only lends legitimacy to these digital assets but also sends a strong signal to the market that the transition to blockchain-based digital payments has become an irreversible reality.”
Corporate Treasury Management
Stablecoins have become an essential tool in corporate treasury management for multinational companies, especially with rising interest rates on some stablecoins offering competitive yields of up to 4.5% annually. According to the British Association of Corporate Treasurers, 37% of large companies now hold part of their cash reserves in stablecoins.
Global B2B Payments
The business-to-business (B2B) payments sector has been significantly transformed with the adoption of stablecoins, allowing companies to settle international payments instantly and at low cost. A Pymnts.com report indicated that the volume of B2B payments made through stablecoins reached $82 billion in the first half of 2025.
Protection from Currency Fluctuations
Amid geopolitical tensions and economic fluctuations, companies have found in stablecoins a safe haven to protect the value of their assets, especially in emerging markets suffering from high inflation or sharp fluctuations in local currency exchange rates.
Corporate Strategies for Stablecoin Adoption
Traditional Model
- Using existing stablecoins like USDC or USDT
- Integration with digital asset service platforms like Fireblocks and Metamask Institutional
- Focus on specific applications such as cross-border payments and liquidity management
- Holding a modest percentage of reserves (5-15%) in stablecoins
Advanced Model
- Issuing company-specific stablecoins (Branded Stablecoins)
- Participating in stablecoin issuance associations like Fnality and HISA
- Comprehensive integration of stablecoins in supply chains, payments, and treasury
- Developing custom financial applications based on stablecoins and smart contracts
Governments Explore Bonds on Blockchain

Impact of stablecoins on government bond markets in 2025
The Shift Towards Digital Bonds
In a remarkable development during 2025, many governments began exploring the possibility of issuing government bonds on blockchain, using stablecoins as a means for subscription, trading, and interest payments. The US Treasury responded to this trend by requesting guidance from Primary Dealers about integrating stablecoins into government bond markets.
- Singapore: Guardian project for digital bonds worth $1.5 billion
- Japan: Experimental issuances of government bonds on the Progmat platform
- Luxembourg: Issuance of green bonds via blockchain
- Hong Kong: Project Genesis platform for digital bonds
- South Korea: BOK-Bond digital bond testing program
Benefits and Advantages
Issuing government bonds on blockchain using stablecoins provides numerous benefits for both governments and investors, through increased operational efficiency, reduced costs, and expanding the potential investor base. Estimates suggest that this approach could save up to $4.6 billion annually in issuance, settlement, and administration costs for global bond markets.
Key Advantages of Blockchain-Based Bonds:
- T+0 Settlement: Instant transaction settlement compared to T+1 or T+2 in traditional systems
- Bond Fractionalization: Ability to divide bonds into smaller units, expanding the investor base
- Lower Costs: Reducing issuance and trading costs by up to 70%
- Automatic Interest Distribution: Using smart contracts to pay interest directly and instantly to investors
- 24/7 Secondary Market: Ability to trade bonds around the clock throughout the week
Case Study: Singapore Leading the Way
In January 2025, Singapore launched the “Guardian” project, representing the largest issuance of government bonds on blockchain to date, valued at $1.5 billion. The project used the XSGD stablecoin pegged to the Singapore dollar for subscription and trading, and allowed bonds to be fractionalized into units worth just $100, leading to a 320% increase in retail investor participation.
The project achieved remarkable results in reducing operational costs by 82% and shortening the issuance time from 5 days to less than 24 hours. As a result of the successful experiment, Singapore announced plans to issue 15% of its government bonds on blockchain by the end of 2026.