Integrating Oscillator Indicators and Trading Volume: An Integrated Strategy for Identifying Reversal Points
Integrating Oscillator Indicators and Trading Volume: An Integrated Strategy for Identifying Reversal Points
Identifying reversal points in financial markets is one of the most important challenges facing traders and investors. These points represent golden opportunities to start new trades or close existing ones with maximum profit. In order to identify these points with higher accuracy, analysts resort to an integrated strategy that combines oscillator indicators and trading volume, which we will review in detail in this article.
“The combination of oscillator indicators and trading volume gives the trader a three-dimensional view of the market: price direction, momentum strength, and participation confirmation. This integration is one of the most powerful tools for identifying potential reversal points before they occur.”

Understanding Oscillator Indicators: The Basis for Identifying Reversal Points
Oscillator indicators are analytical tools that move between certain values and help detect overbought and oversold conditions in the market. When these indicators reach extreme levels, they often indicate the possibility of a reversal in price direction.

The Relative Strength Index (RSI) and how it identifies overbought and oversold areas as an indicator of possible reversal
Main Oscillator Indicators and Their Characteristics:
- Relative Strength Index (RSI): Measures the speed and change of price movements, with values above 70 considered overbought and below 30 considered oversold.
- Stochastic Oscillator: Compares the current closing price with the price range over a specified period, helping to identify turning points faster than RSI.
- Moving Average Convergence Divergence (MACD): Combines price trend and momentum, providing signals through the crossing of the MACD line with the signal line.
- Money Flow Index (MFI): Similar to RSI but incorporates trading volume in its calculations, making it more sensitive to changes.
Despite the strength of these indicators, they suffer from the problem of false signals, especially in markets with strong trends. That’s where integrating them with volume indicators comes in to provide additional confirmation of the validity of reversal signals.
Advantages of Using Oscillator Indicators
- Providing proactive signals of potential reversals before they are confirmed by price
- Ability to identify market saturation conditions that often precede corrections
- Can be used in various time frames from minute to weekly
- Easy to read visually even by beginner traders
- Adaptable to different types of financial assets (stocks, currencies, commodities)
Limitations of Relying on Oscillator Indicators Alone
- False signals in markets with strong and continuous trends
- Delay of some indicators in responding to rapid price changes
- Sometimes contradictions between signals from different indicators
- Some do not take into account the factor of market participation (volume)
- Need to adjust indicator settings (number of periods) according to market conditions
The Importance of Trading Volume in Confirming Price Signals

The complementary relationship between trading volume and price movement in determining trend strength
Trading volume is a measure of the number of contracts or shares traded during a certain period of time. It represents the level of participation and interest in the market, and thus reflects the strength of the current price trend. Its great importance lies in its function as a confirmatory tool for price movement.
“Price leads and volume confirms. Price movement without support from proportional trading volume is like a car running without enough fuel, and it’s likely to stop at any moment.”
The philosophy of using volume is based on a fundamental principle: correct and sustainable price movements are supported by high trading volumes, while weak movements of questionable continuity are accompanied by low trading volumes.

Different volume patterns and their implications for the strength of price movement and likelihood of continuation
1. Positive Confirmation
When price and volume move in the same direction, this is considered a positive sign of the validity of the current trend. For example, a rising price with an increase in trading volume confirms the strength of the uptrend.
Example: A strong rise in a stock accompanied by trading volumes exceeding the average of previous days by 200% enhances confidence in the continuation of the rise.
2. Negative Divergence
When price continues to rise but with a gradual decrease in trading volume, this indicates weakness in momentum and the possibility of a downward reversal soon. This pattern is one of the strongest indicators of peak reversal points.
Example: Price reaching new record levels with a decrease in trading volumes compared to previous peaks is considered a warning of potential price collapse.
3. Positive Divergence
When price continues to decline but with decreasing trading volumes, this indicates the likely end of the downtrend and the possibility of an upward reversal. This pattern is effective in identifying bottoms.
Example: Price declining to historical support levels with a notable decrease in selling volume indicates the depletion of selling pressure and the approaching recovery.
Main Volume Indicators
- On-Balance Volume (OBV): Accumulates and subtracts volume based on price movement, helping to determine the flow of money into or out of the asset
- Money Flow Index (MFI): Combines price and volume to measure buying and selling pressure on a scale from 0 to 100
- Chaikin Money Flow: Measures the accumulation and distribution of funds over a specific period
Advanced Volume Indicators
- Accumulation/Distribution Line (A/D Line): Helps confirm trends or indicate potential divergences
- Volume-Weighted Average Price (VWAP): Reflects the average price weighted by trading volume, used as a reference for fair value
- Volume Impulse Indicator: Measures volume change relative to its moving average, helping to identify unusual volume impulses
Strategies for Integrating Oscillator Indicators with Trading Volume to Identify Reversal Points
Integrating oscillator indicators with Japanese candlestick patterns and trading volume to identify reversal points with higher accuracy
The integration between oscillator indicators and trading volume represents an integrated methodology that combines momentum and participation, giving the trader a deeper insight into market dynamics. There are several strategies to achieve this integration effectively.
Principles of Effective Integration:
- Looking for common divergences between indicators, price movement, and trading volume
- Confirming oscillator indicator signals with compatible volume behavior
- Using multiple time settings to ensure signal synchronization across more than one time frame
- Giving greater weight to signals that appear at key support and resistance levels
- Focusing on reversal points where signals from multiple indicators converge
1. Dual Divergence Strategy
Based on looking for divergences between price and oscillator indicator on one hand, and between price and trading volume on the other. When these divergences coincide, it’s a strong signal of a possible trend reversal.
Example: When the price reaches a new peak while the RSI fails to exceed its previous peak (negative divergence), and this is accompanied by a decrease in trading volume compared to the previous peak, this is a strong signal of a potential downward reversal.
2. Momentum Saturation with Volume Explosion Strategy
Focuses on monitoring oscillator indicators when they reach overbought or oversold levels, then looking for a sudden and significant increase in trading volume as confirmation of the beginning of the reversal.
Example: When the RSI is below level 30 (oversold) for a long period, then begins to rise with a significant increase in trading volume (exceeding the average of previous days by 150% or more), this indicates a strong upward reversal.
3. Key Levels Testing Strategy
Combines key support and resistance levels with oscillator indicators and trading volume. It focuses on monitoring the behavior of oscillator indicators and volume when price tests important levels.
Example: When price tests a major resistance level for the second time, and lower readings appear in the Stochastic indicator compared to the first test, with a decrease in trading volume, this confirms the weakness of buying power and the likelihood of a failed breakout and downward reversal.

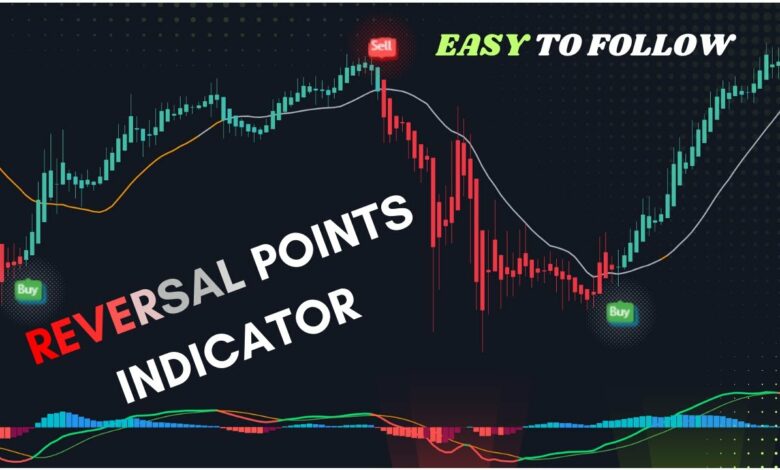
Example of identifying reversal points using a mix of oscillator indicators and volume patterns
4. Volume and Oscillator Indicators Convergence Strategy
Based on looking for simultaneous confirmations from indicators that combine price and volume (such as MFI) and traditional oscillator indicators (such as RSI). When signals agree, the probability of reversal is higher.
Example: A positive divergence appearing in the MFI indicator (recording a higher bottom) simultaneously with a positive divergence in the RSI indicator gives a strong signal for the reversal of the downtrend to an uptrend.
5. Reversal Patterns Confirmation Strategy
Integrates classic price reversal patterns (such as head and shoulders, double tops and bottoms) with signals from oscillator indicators and trading volume to confirm the validity of these patterns.
Example: When a double top pattern forms, the reversal is more reliable if the second peak is accompanied by a lower reading in the MACD indicator and less trading volume than the first peak, followed by a significant increase in trading volume when breaking the neckline.
Practical Examples of Reversal Points Identified Using the Integrated Method

Example of an upward reversal identified through positive divergence in the RSI indicator with support from an increase in trading volume
First Example: Downward Reversal in an Uptrend Market
In this example, we observe the following steps to identify a downward reversal point:
- Price reached new record levels after a strong uptrend
- RSI indicator showed negative divergence (failed to reach a new peak despite price reaching a new peak)
- MACD indicator began to form a downward crossover despite the continued rise in price
- Trading volume gradually decreased during the final stage of the rise (negative divergence in volume)
- When a strong bearish candle formed, trading volume increased significantly confirming the beginning of the reversal
Result: Price decreased by 15% during the following two weeks, providing an excellent opportunity to sell or open short positions.
Second Example: Upward Reversal in a Downtrend Market
In this example, an upward reversal point was identified through:
- Price reaching an important historical support level after a continuous downtrend
- Stochastic indicator reaching the oversold area (below 20) and beginning to form an upward crossover
- Money Flow Index (MFI) showing positive divergence (recording a higher bottom than the previous bottom despite price decline)
- Trading volume decreasing with each new downward wave (indicating weakening selling pressure)
- Appearance of a reversal candle (hammer) at the support level with a significant increase in trading volume
Result: Price increased by 23% during the following month, providing an excellent opportunity to buy at the market bottom.

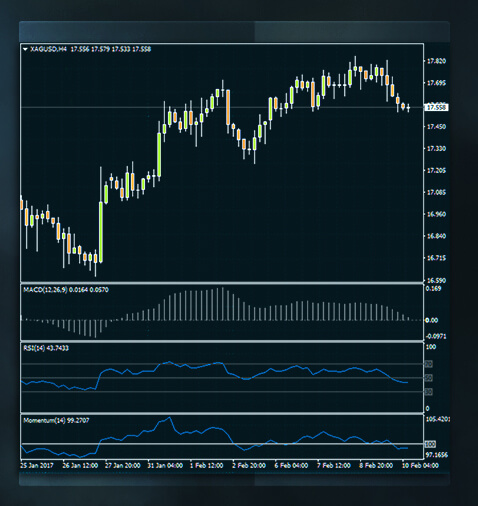
Example of a downward reversal confirmed through negative divergence in trading volume with oscillator indicators
Tips for Increasing the Accuracy of Identifying Reversal Points
- Wait for Confirmation: Don’t rush into making a decision based on an initial signal; wait for confirmation through price movement
- Use Multiple Indicators: Don’t rely on a single oscillator or volume indicator; use an integrated set
- Pay Attention to the Time Frame: Signals on larger time frames are more reliable than smaller time frames
- Watch Candlestick Patterns: Integrating Japanese candlestick patterns with oscillator indicators and volume increases analysis accuracy
Additional Success Factors
- Consider Macro Market Factors: Reversals are stronger when they coincide with changes in monetary policies or important economic reports
- Monitor Related Markets: Confirmations from related markets (such as bonds with stocks) increase signal reliability
- Don’t Ignore Support and Resistance Levels: Reversals at key levels are more likely to succeed
- Set a Risk Management Plan: Even with the best analyses, always set an appropriate stop loss to protect capital
Important Warning for Traders
Despite the strength of this integrated strategy in identifying reversal points, it is not infallible. Financial markets are volatile by nature and unexpected movements may occur due to external factors (news, government interventions, crises).
Therefore, it is always recommended to combine this strategy with strict risk management, not to oversize positions, to use appropriate stop-loss orders, and to diversify investments for protection against systemic risks.
Conclusion: Towards an Integrated Approach to Identifying Reversal Points
The integration between oscillator indicators and trading volume is a strong and comprehensive methodology for identifying potential reversal points in financial markets. While oscillator indicators provide early signals about momentum change and the possibility of reversal, trading volume comes to confirm these signals by reflecting the level of participation and interest in the market.
The integrated approach gives the trader a great competitive advantage, allowing them to verify the validity of signals from multiple sources, thereby reducing the percentage of false signals and increasing the success rate of trades. It also helps in determining better timing for entering and exiting trades, leading to an improved risk-to-reward ratio.
However, we must remember that this strategy, like any other trading strategy, is not a magical recipe for guaranteed success. Financial markets are complex and variable, affected by multiple factors that may not be fully reflected in technical indicators. Therefore, continuous practice, learning from experiences, developing market sense, along with the accurate application of this strategy, are the keys to long-term success in the world of trading.
“The best strategies are those that combine science and art; science represented in indicators and technical analysis, and art represented in the ability to read the pulse of the market and the behavior of its participants. Integrating oscillator indicators with trading volume represents an embodiment of this integration, and opens wide horizons for a deeper understanding of market dynamics and movements.”